Page 668 |
DICOM PS3.3 2020a - Information Object Definitions |
|
|
|
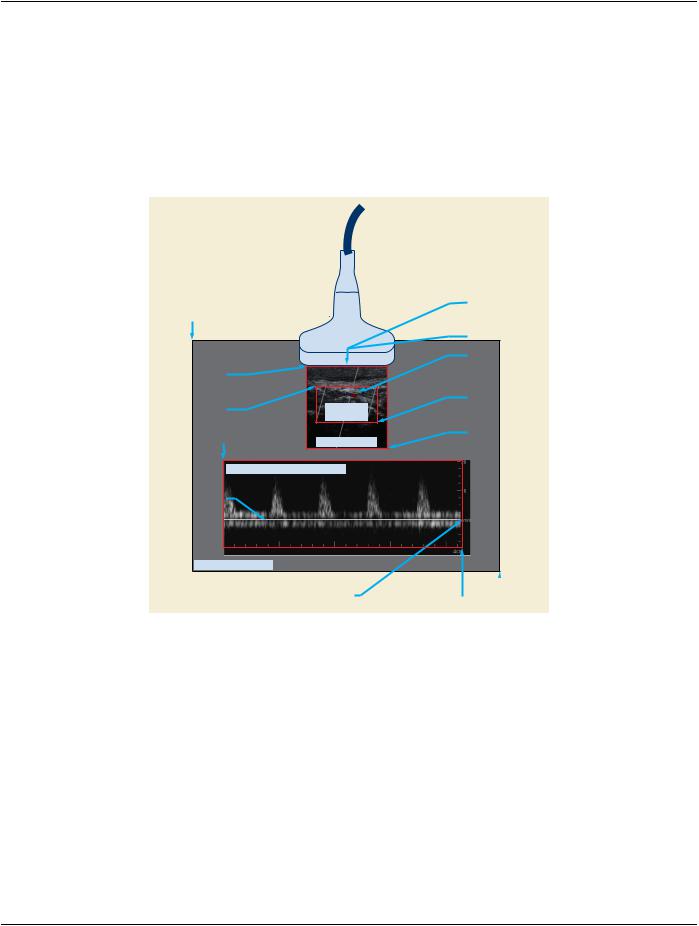
2D - Tissue |
|
|
|
Reference Pixel |
|
Screen origin offset |
|
x0, y0 = (100,0) |
|
|
|
|
(0,0) |
|
2D – Tissue |
|
|
|
|
2D – Tissue |
|
Region Location Max |
|
|
x1, y1 = (432,168) |
|
Region Location Min |
|
|
|
|
|
x0, y0 = (232,31) |
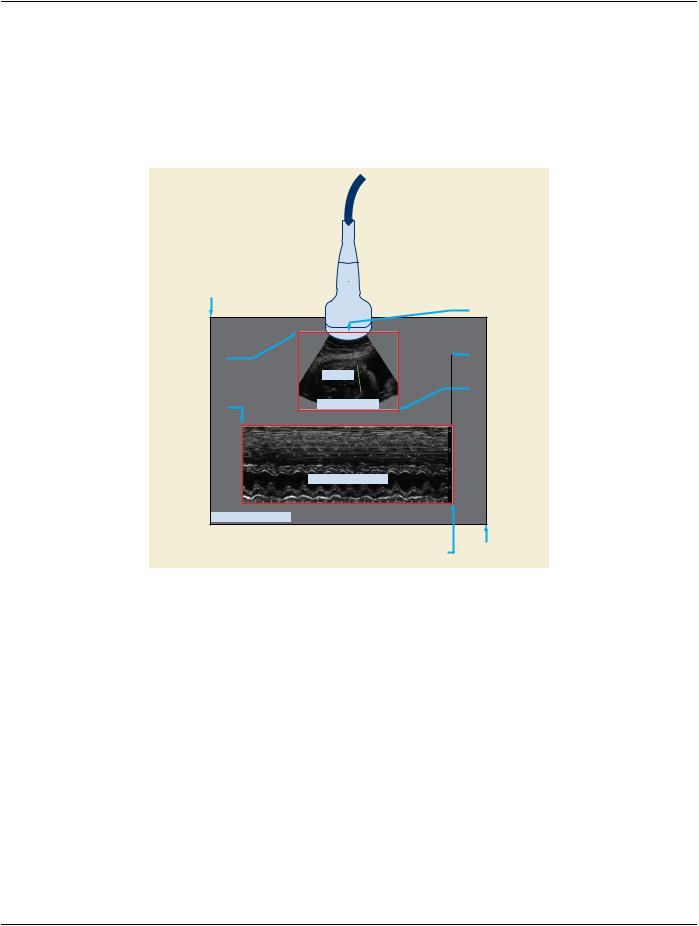
TM-Line |
M-Mode - Tissue |
|
|
|
|
|
|
Reference Pixel |
|
M-Mode – Tissue |
2D Tissue Region |
x0, y0 = (490,0) |
|
|
|
|
Region Location Min |
|
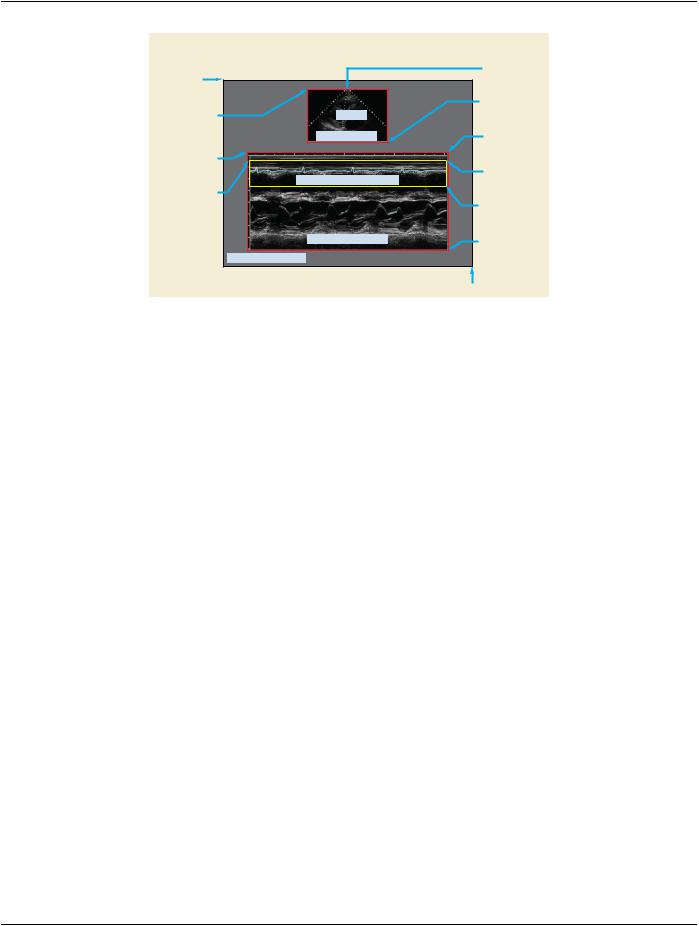
ECG |
|
x0, y0 = (80,192) |
|
|
|
Reference Pixel |
|
|
|
|
ECG |
|
x0, y0 = (480,0) |
|
Waveform - ECG Trace Region |
|
|
Region Location Min |
ECG |
|
|
|
X0, y0 = (85,207) |
|
|
|
Region Location Max |
|
|
|
|
|
|
x1, y1 = (565,252) |
|
|
|
M-Mode – Tissue |
|
|
M-Mode Tissue Region |
Region Location Max |
|
|
x1, y1 = (570,435) |
|
|
Pixel coordinate system |
|
|
|
|
(639, 479) |
Figure C.8-4. 2D, M-Mode, & Waveform Regions with Reference Pixel
C.8.5.5.1.16.5 Waveform - Doppler Mode, Mean and Max Trace
Doppler Traces have a Region Spatial Format (0018,6012) value of 0004H (Waveform) and a Region Data Type value of 0005H (Doppler Mean Trace), 0006H (Doppler Mode Trace) or 0007H (Doppler Max Trace). The Reference Pixel x0 (0018,6020) specifies the time origin as the time of frame capture. The Reference Pixel y0 (0018,6022) is the Doppler Baseline position (zero velocity / frequency position).
C.8.5.5.1.16.6 Graphics Spatial Formats
For regions with Region Spatial Format (0018,6012) value of 0005H (Graphics) the reference pixel location has no meaning.
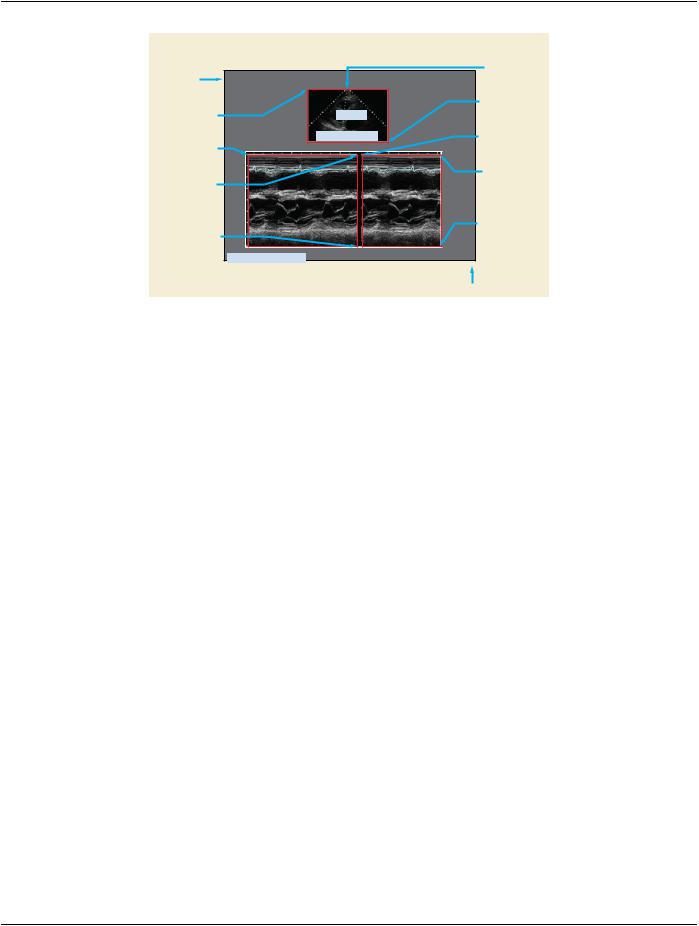
C.8.5.5.1.16.7 Treatment of Sweeping Regions
Time-based display of data may scroll the acquired data from a fixed horizontal location to the left. Alternatively, sweep-based display increments the horizontal location of the acquired data, overwriting previously acquired data to the right. When the horizontal location corresponding to zero time has completely swept over the older data, writing wraps from the left of the region. Thus, sweep-based displays have a time discontinuity. The measurement of time intervals across the discontinuity requires special treatment. The time interval between two points across the discontinuity is equal to the region's time width minus the point separation. The sweeping area can be treated as a single region. The Reference Pixel x0 should indicate the time origin for the multi-frame image, which will be the location of the sweeping region's discontinuity line for the first frame of the multi-frame image. In order to specify that this is actually the location of the discontinuity line, the Reference Pixel Physical Value X (0018,6028) must be set to 0 seconds. This indicates that this location corresponds to the time at which the first frame was acquired.
It is useful to be able to calculate the location of the discontinuity line for subsequent frames of a multi-frame image. This is necessary if one is to determine whether two points are on opposite sides of the discontinuity line and also to correctly calculate the difference in time between such points. The x-axis location of the discontinuity line, x, for a given frame number, y, can be calculated from the Reference Pixel x0, x0, the Reference Pixel x1, x1, the time offset for frame y, t, (determined from the Frame Time Vector (0018,1065) or Frame Time (0018,1063)) and the Physical Delta X (0018,602C), px, as follows:
x = x0 + modulus((t / px) / (x1 - x0))
Alternatively, two regions can be used, one on each side of the time discontinuity. Figure C.8-5 shows the use of two regions. Note that the two region approach is not valid for multi-frame images, as the same region scaling must apply to all the frames.