Материал: m933302e
2 - The Visualization Editor in CoDeSys
Meter
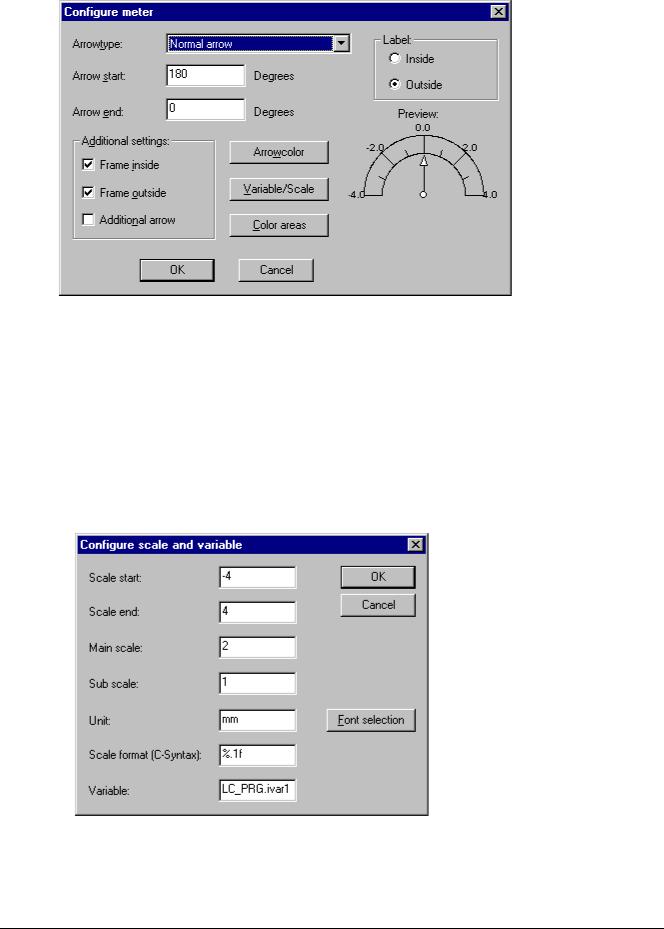
Dialog for the configuration of a Meter element
This dialog will open automatically as soon as you insert a Meter into a visualization object. A Preview is part of the dialog, immediately showing how the element will look as a result of the currently set parameters:
Arrowtype: Define the type of the arrow which will point at the current value on the Meter. Possible types: Normal arrow, Thin arrow, Wide arrow, Thin needle.
Arrow start, Arrow end: Here you define the start and the end positions of the scale on a virtual circular arc in ° Degrees (angle). (Example: a Start angle of 180° and an End angle of 0° will define a upturned semicircle).
Arrow color: This button opens the standard dialog for choosing a color. Define the color of the pointer.
Variable/Scale: This button opens the dialog Configure scale and variable:
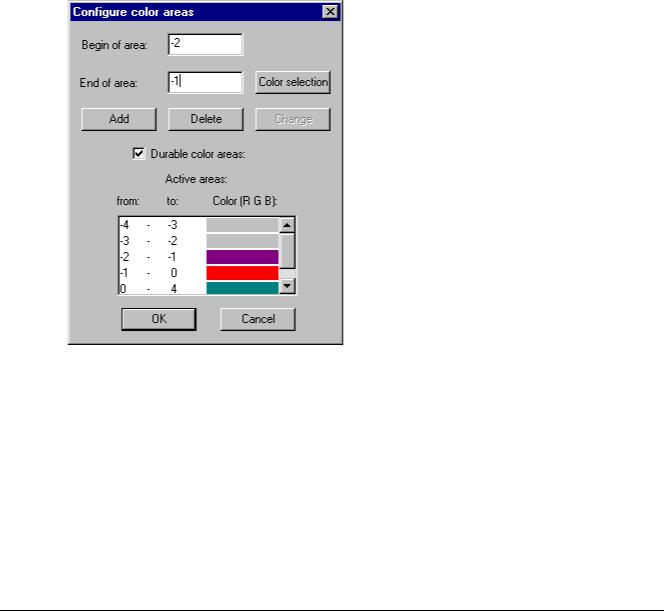
Dialog for Configuring the Scale and Variable for a Meter element
Scale start, Scale end: lowest and highest value on the scale, e.g. "-4" and "4".
2-30 |
The CoDeSys Visualization |
2 - The Visualization Editor in CoDeSys
Main scale: Define which intervals on the scale should be marked "with all", that means which should get a scale pitch and a label. If you insert e.g. "2", each second integer value will be indicated.
Sub scale: In addition to the main scale (Label + long pitch lines) here you can define a sub-scale which will be displayed as short pitch lines without any labels.
Unit: Define here the scale unit, e.g. "cm" or "sec". The unit is indicated by a label at the origin of the pointer.
Scale format (C-Syntax): According to the C-syntax you can define the display format of the scale labels; see the description concerning Category 'Text'.. Example: If you insert "%1.1f" the scale values will be indicated by a floating point number with one decimal place before and one after the comma (e.g. "12.0")
Variable: Here you can define a variable which is assigned to the pointer position. (e.g. "PLC_PRG.posvar")
Font selection: This button will open the standard dialog for defining the font used in the Meter element.
Color areas: This button opens the dialog Configure color areas: Here you can define a separate color for each partition of the scale.
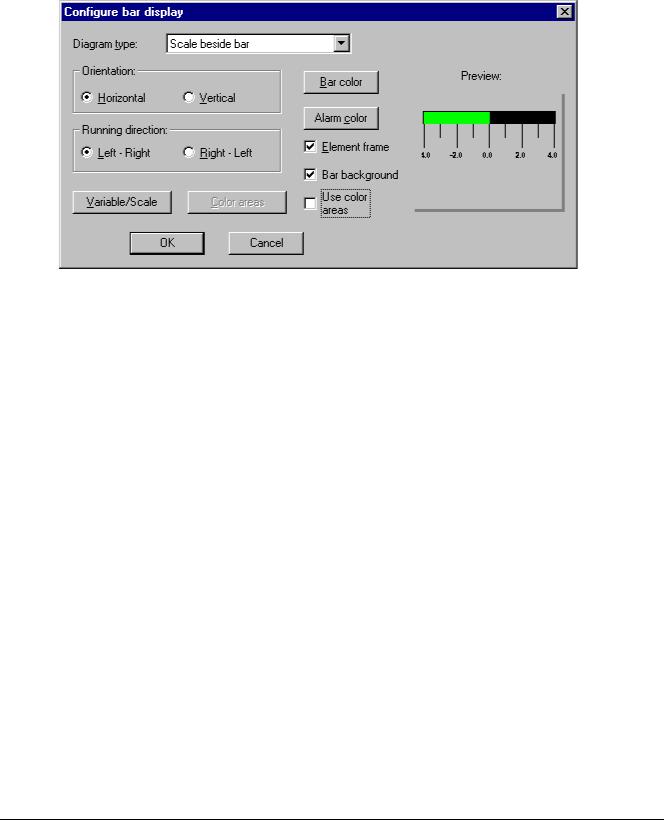
Dialog for the configuration of color areas for a Meter
Begin of area, End of area: Insert here the start and end values of the scale partition which should get the color defined in the following:
Color selection: This button opens the standard dialog for choosing a color. Confirm your selection with OK, which will close the dialog, and press button Add, whereupon the color and the assigned partition of the scale will be added to the window 'Active areas'. In order to remove an already defined area, select the entry and press Delete.
If the option Durable color areas is activated, the defined color ranges will be displayed permanently, otherwise in online mode just that partition of the scale will be colored which contains the current value of the respective value.
Label: Depending on which of the options is activated (inside or outside), the scale labels are placed at the inside or the outside of the circular arc of the scale.
The CoDeSys Visualization |
2-31 |
2 - The Visualization Editor in CoDeSys
Additional settings:
Frame inside, Frame outside: If one or both of these options is/are activated, an inner or outer frame will be added to the scale arc.
Additional arrow: In addition to the main pointer a little arrow will indicate the current value directly on the scale.
Bar Display
Dialog for the configuration of a Bar Display element
This dialog will be opened as soon as you insert a Meter element into a visualization object. A Preview is part of the dialog, immediately showing how the element will look as a result of the currently set parameters:
Diagram type: Choose one of the options: 'Scale beside bar', 'Scale inside bar' und 'Bar inside scale'.
Orientation: Define one of the options: Horizontal or Vertical bar.
Running direction: Choose whether the bar should be elongated corresponding to a growing value of the assigned variable in Left – Right or in Right – Left direction.
Bar color: This button opens the standard dialog for choosing a color. Define a color for the bar in normal state (no alarm). If option 'Use color areas' (see below) is activated, no entries are possible.
Alarm color: This button opens the dialog Configure alarm, where you define at which value the bar will be displayed in alarm color and which is the alarm color: Insert the desired limit value in the edit field and activate one of the Conditions greater than or lower than, in order to define whether values higher or lower than the limit value should set off an alarm. Press button Alarm color to open the standard color dialog for choosing an alarm color. Close both dialogs with OK in order to confirm the settings and to return to the main dialog for configuring the bar display. If the option 'Use color ranges' (see below) is activated, no entries are possible.
Variable/Scale: This button opens the dialog Configure scale and variable, which corresponds to that used for the Meter element.
Element frame: If this option is activated a frame will enclose the bar display.
Bar background: If this option is activated, the whole display range will be indicated by a black bar in the background of the current values' bar, otherwise only the current values' bar will be displayed.
Use color areas: If this option is activated, any settings defined in the dialogs for 'Bar color' and 'Alarm color' (see above) will not be valid. In this case the color area definitions will be used, which have been made in the dialog 'Configure color areas'. This dialog can be opened by pressing button 'Color areas' (see below)
2-32 |
The CoDeSys Visualization |
2 - The Visualization Editor in CoDeSys
Color areas: This button opens the dialog Configure color areas where you can define a separate color for each partition of the scale. These definitions will only be valid if the option 'Use color areas' (see above) is activated. Use the dialog as described for the Meter element.
Histogram
A histogram element can be used to visualize an array. The values of the array elements will be represented by bars or lines side by side, indicating the current values of the element by their height.
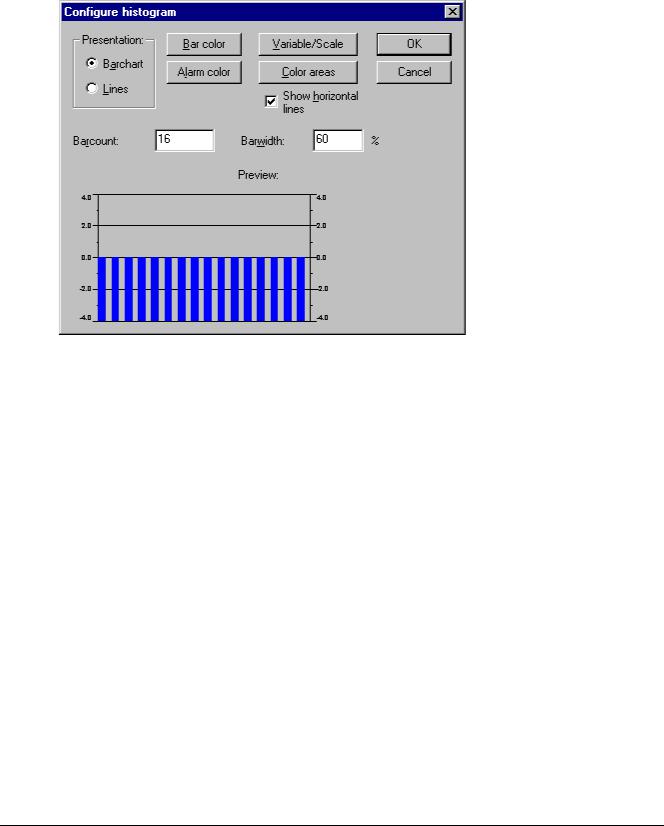
Dialog for the configuration of a Histogram
The configuration dialog will be opened as soon as you insert a histogram element into a visualization object. A Preview is part of the dialog, immediately showing how the element will look as a result of the currently set parameters:
Presentation: Activate one of the options Barchart or Lines.
Show horizontal lines: If this option is activated, horizontal lines spanning the diagram will additionally display the scale gradation.
Alarm color: This button opens the dialog Configure alarm, where you define at which value the bar will be displayed in alarm color and which is the alarm color: Insert the desired threshold value in the edit field and activate one of the Conditions greater than or less than, in order to define whether values higher or lower than the limit value should set off an alarm. Press button Alarm color to open the standard color dialog for choosing an alarm color. Close both dialogs with OK in order to confirm the settings and to return to the main dialog for configuring the histogram.
Variable/Scale: This button opens the dialog Configure scale and variable, which can be filled like described for the Meter element.
Color areas: This button opens the dialog Configure color areas: Here you can define a separate color for each partition of the scale. See the description of the Meter where the same dialog is available.
Bar color: This button opens the standard dialog for choosing a color. Define a color for the bar in normal state (no alarm).
Define which range of the array should be displayed: Arraybegin: First array element to be displayed (Index). Arrayend: Last array element to be displayed (Index).
Barwidth: Define the width of the bars in percent by the total width available for one bar.
The CoDeSys Visualization |
2-33 |
2 - The Visualization Editor in CoDeSys
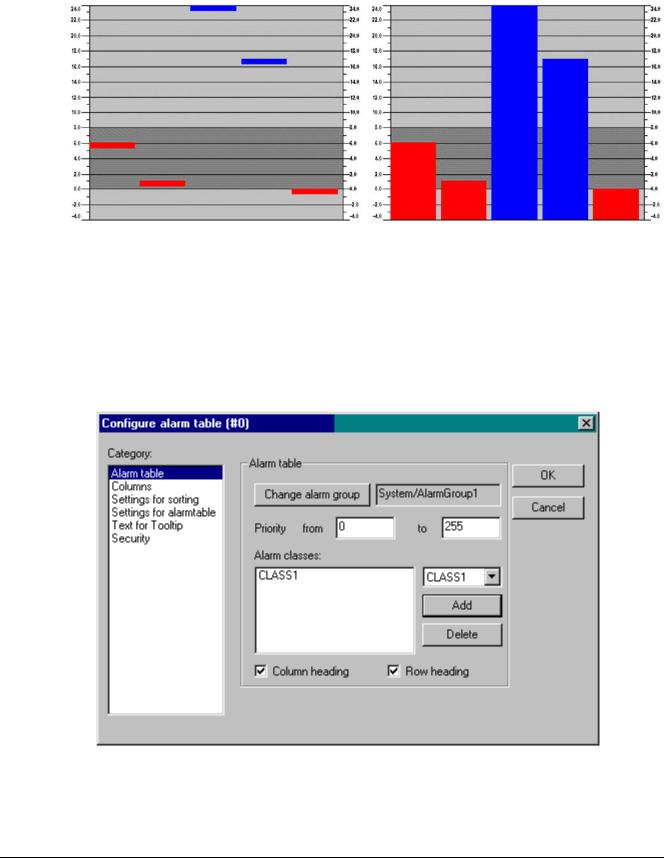
Example:
See in the following picture an example of the online display (bars resp. lines) of a histogram which represents an array arr1 [0..4] of INT. The number of bars appropriately was set to "5", the scale start to "–4", the scale end to "24", the main gradation was set to "2", the sub-gradation to "1" and the scale range 0 – 8 has got assigned another color (dark grey) than the rest of the scale range. Further on the bars should be displayed alarm-colored (blue) as soon as the value of the corresponding array element exceeds "8". You see the array elements arr1[2] and arr1[3] currently being in alarm state:
Alarm table
The element 'Alarm table' is used to visualize alarms, which must be defined before in the CoDeSys Alarm configuration.
As soon as the element gets inserted in the visualization object, the dialog 'Configure alarm table'. Besides the known categories for configuration of tooltip and security the following settings concerning display and selection in the table can be made:
Category Alarm table:
Dialog for configuration of a alarm table, category Alarm table
Define what you want to get displayed in the alarm table:
2-34 |
The CoDeSys Visualization |