Материал: m933302e
2 - The Visualization Editor in CoDeSys
nFontHeight : INT; |
Font height in Pixel. |
vis1.nFontHeight:=16; |
- Cat. Text: Font | Grad' |
|
|
should be in range 10- |
(Text height is 16 pt) |
- Cat. Textvariables: |
|
|
96 |
|
Font heigth |
|
|
|
|
|
|
dwFontFlags : |
Font display. Available |
vis1.dwFontFlags:=10; |
- Cat. Text: Schrift | |
|
DWORD; |
flags: |
(Text is displayed blue and canceled) |
Schriftschnitt |
|
|
1 italic |
|
- Cat. Textvariables: |
|
|
|
Fontflags |
||
|
2 fett |
|
||
|
4 underlined |
|
|
|
|
8 canceled |
|
|
|
|
+ combinations by |
|
|
|
|
adding values |
|
|
|
|
|
|
|
|
stFontName : STRING; |
Change font |
vis1.stFontName:=’Arial’; |
- Cat. Text: Schrift | |
|
|
|
(Arial is used) |
Schriftart |
|
|
|
|
- Cat. Textvariables: |
|
|
|
|
Fontname |
|
|
|
|
|
|
nLineWidth : INT; |
Line width of the |
vis1.nLWidth:=3; |
- Cat. Line width |
|
|
frame (pixels) |
(Frame width is 3 Pixels) |
|
|
|
|
|
|
|
dwFillColor : DWORD; |
Fill color (definition of |
vis1.dwFillColor":=16#00FF0000; |
- Cat. Color: Color | |
|
|
colors see subsequent |
(Element ist im "Normalzustand" blau) |
Inside |
|
|
to this table) |
|
- Cat. Colorvariables: |
|
|
|
|
Inside |
|
|
|
|
|
|
dwFillColorAlarm : |
Fill color as soon as |
vis1.dwFillColorAlarm:=16#00808 |
- Cat. Color: Alarm |
|
DWORD; |
bToggleColor gets |
080; |
color | Inside |
|
|
TRUE, see above) |
(as soon as Variable togglevar gets |
- Cat. Colorvariables: |
|
|
(definition of colors |
TRUE, the element will be displayed grey- |
Inside Alarm |
|
|
see subsequent to this |
colored) |
|
|
|
table) |
|
|
|
|
|
|
|
|
dwFrameColor: |
Frame color |
vis1.dwFrameColor:=16#00FF0000; |
- Cat. Color: Color | |
|
DWORD; |
(definition of colors |
(Frame is blue-colored) |
Frame |
|
|
see subsequent to this |
|
- Cat. Colorvariables: |
|
|
|
Frame |
||
|
table) |
|
||
|
|
|
||
|
|
|
|
|
dwFrameColorAlarm: |
Fill color as soon as |
vis1.dwFrameColorAlarm:=16#0080 |
- Cat. Color: Alarm |
|
DWORD; |
bFrameColor gets |
8080; (as soon as Variable |
color | Frame |
|
|
TRUE, see above |
vis1.bToggleColor gets TRUE, the frame |
- Cat. Colorvariables: |
|
|
(definition of colors |
will be displayed grey-colored) |
Frame Alarm |
|
|
see subsequent to this |
|
|
|
|
table) |
|
|
|
|
|
|
|
|
dwFillFlags: DWORD; |
Color, as defined by |
vis1.dwFillFlags:=1; |
- Cat. Color: No color |
|
|
the color variables, |
(element gets invisible) |
inside + No frame |
|
|
can be displayed or |
|
color |
|
|
ignored |
|
- Cat. Colorvariables: |
|
|
0 = show color |
|
Fillflags |
|
|
>0 = ignore setting |
|
|
|
|
|
|
|
|
dwFrameFlags: |
Display of frame: |
vis1.FrameFlags:=1; |
- Cat. Colorvariables: |
|
DWORD; |
0 full |
(Frame will be displayed as dashed line) |
Frameflags |
|
|
1 dashed ( --- ) |
|
|
|
|
2 dotted ( ) |
|
|
|
|
3 dash-point ( _._._ ) |
|
|
|
|
4 dash-point-point |
|
|
|
|
(_.._.. ) |
|
|
|
|
8 blind out line |
|
|
|
|
|
|
|
Defining color values:
Example: e1.dwFillColor := 16#00FF00FF;
The CoDeSys Visualization |
2-25 |
2 - The Visualization Editor in CoDeSys
A color is entered as a hex number which is composed of the Blue/Green/Red (RGB) components. The first two zeros after "16#" should be set to in each case, to fill the DWORD size. For each color value 256 (0-255) colors are available.
FF Blue component 00 Green component FF Red component
Example for a blinking visualization element:
Define a global variable 'blink1' of type VisualObjectType in the configuration of a rectangle. In a program of function block the value of a component of the structure can be modified.
PROGRAM PLC_PRG |
|
VAR |
|
n:INT:=0; |
|
bMod:BOOL:=TRUE; |
|
END_VAR |
|
(* Blinking element *) |
|
n:=n+1; |
|
bMod:= (n MOD 20) > 10; |
|
IF bMod THEN |
|
blinker.nFillColor := 16#00808080; |
(* Grau *) |
ELSE |
|
blinker.nFillColor := 16#00FF0000; |
(* Blau *) |
END_IF |
|
Table
As soon as a table is inserted for the purpose of visualization of an array, the dialog Configure Table will be opened. Besides the categories 'Tooltip' and 'Security' which are also available for other visualization elements, the following categories will be available for configuring display and contents of the table:
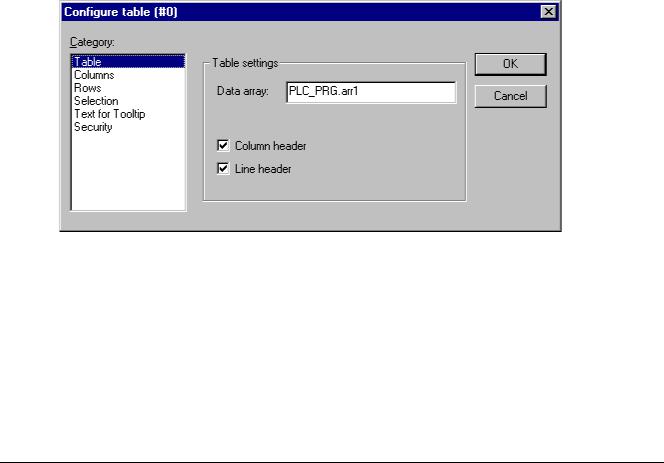
Category Table:
Dialog for the configuration of a Table, Category Table
Do the following table settings:
Data array: Insert the name of an array which should be visualized in the table. It is recommended to use the input assistant (<F2>) resp. the Intellisense function.
Column header, Line header: Activate these options if you want to get displayed the titles in the table. The line title reflects the array index (first column of the table), the column title can be defined in category 'Columns'.
2-26 |
The CoDeSys Visualization |
2 - The Visualization Editor in CoDeSys
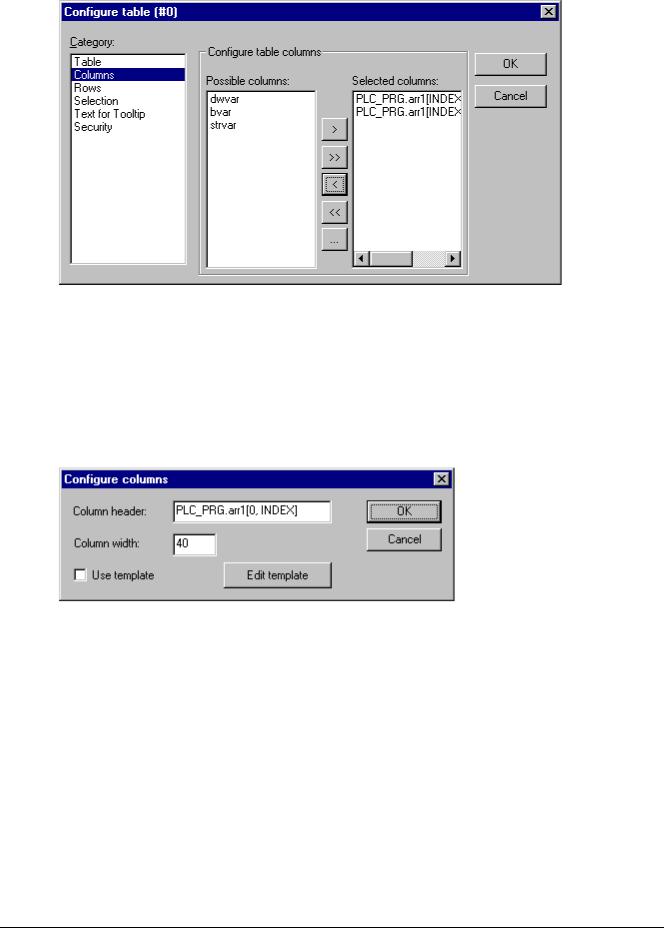
Category Columns:
Dialog for the configuration of a Table, Category Columns
Here you define the table elements. In the left window you get al list of all elements, which are handled in the array per index. In case of an array of a structure these would be the structure components.
Using the arrow button > you can transfer a selected component from the left window to the right window where you define the set of elements to be displayed in the table. Pressing button >> all elements will be transferred at a single blow. In the same manner you can remove elements from an already defined set (<, <<). In order to modify the default settings concerning the display of the table column for one of the elements, perform a double-click on the desired entry in the right part of the window, or press button '...' to open the dialog 'Configure columns':
Dialog for Configuring a Table, Category Columns, Column Properties
Editing the column header and the column width:
Initially the edit field Column header will contain an automatically created title (e.g. "PLC_PRG.arr1[INDEX].iNo" in case of an array of structure. for the column representing the structure component "iNo"). which you can change Further on the Column width (number of characters) can be set.
Editing configuration parameters for all elements of a column:
By default the table fields are displayed as simple rectangles and the entries are not editable. If you however activate the option Use template, a pre-defined set of parameters can be used, e.g. for the line width, the text input possibilities etc. To edit these parameters the common configuration dialogs as know for rectangles, bitmaps, buttons etc. are available, which you can access by a mouse-click on the button Edit template.
In order to define online actions for all entries of a column, i.e. for all array-elements of one array dimension, use the placeholder [INDEX] when entering the array name in the configuration dialogs (e.g. PLC_PRG.arr1[INDEX] like used in the default column header).
The CoDeSys Visualization |
2-27 |
2 - The Visualization Editor in CoDeSys
Example:
You want to visualize an array "arr1 [0..2] of BOOL" (table with 1 column) and you want, that in online mode by a mouse-click on a table cell the cell gets red-colored and the corresponding array element will be toggled and vice versa.
To reach this activate 'Use template' in the configuration dialog for the column and define the template as follows: Category 'Input', Action 'Toggle variable': "PLC_PRG.arr1[INDEX]. Category 'Colors': Alarm color red.
Category 'Variables', Action 'Change color': "PLC_PRG.arr1[INDEX].
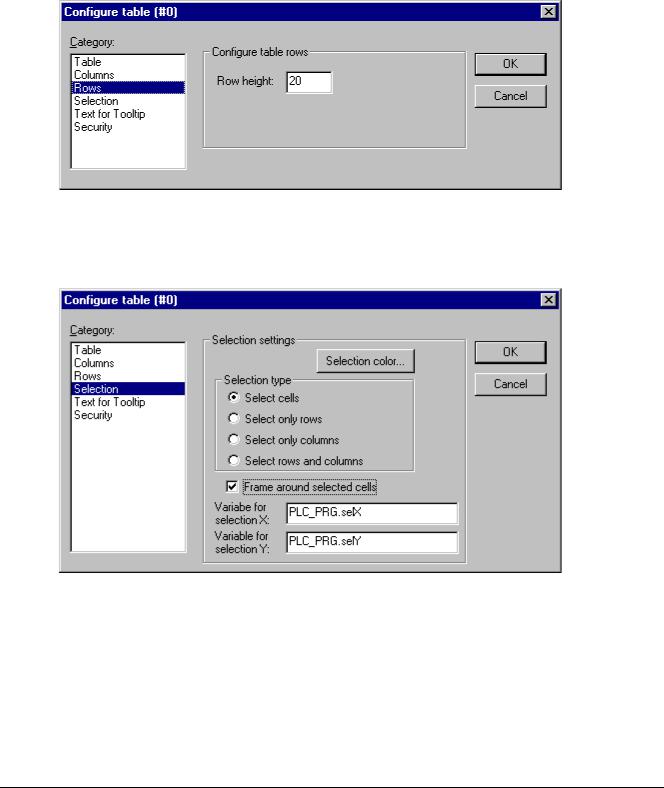
Category Rows:
Dialog for configuring a Table, Category Rows
Row height: Insert the desired height in number of pixels.
Category Selection:
Dialog for configuring a Table, Category Selection
Here you can set the following parameters concerning the selection behaviour within the table:
Selection color: Press this button to get the standard color dialog for choosing a color for selected cells.
Selection type: Define which part of the table will be selected when you perform a mouse-click on one of the table fields in online mode:
Select single cells: Only the cell will be selected.
Select only rows: The whole line will be selected.
2-28 |
The CoDeSys Visualization |
2 - The Visualization Editor in CoDeSys
Select only columns: The whole column will be selected.
Select rows and columns: The whole column and line will be selected.
Frame around selected cells: A selected cell gets surrounded by a frame.
Variable for selection X, Variable for selection Y: Here you each can enter a project variable, which will indicate the X- resp. Y-Index of the selected table cell.
Example: Create a table element visualizing the array of a structure:
Define the following structure:
TYPE strucTab :
STRUCT
iNo: INT; bDigi : BOOL; sText:STRING; byDummy: BYTE;
END_STRUCT
END_TYPE
In PLC_PRG define the following array:
arr1:ARRAY [1..5] OF strucTab;
and the following variables:
selX:INT;
selY:INT;
Create a visualization object and insert a table element. Configure like follows:: Cat. Table: data array: "PLC_PRG.arr1"
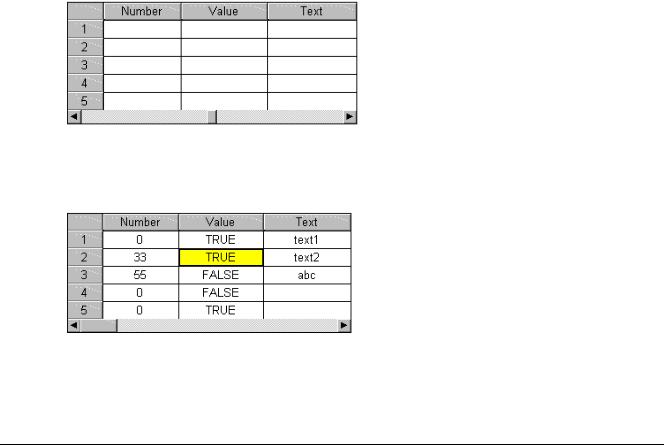
Cat. Columns: (Close the dialog which will open with YES) – Transfer the components iNo, bDigi, sText to the right window - In the right window perform a double-click on the first entry (PLC_PRG.arr1[INDEX].iNo) and in the dialog which will open, replace the default title by "Number". Confirm with OK and also define new column titles for the other two entries (e.g. "Value" and "Text"). – In category 'Spec.Table' enter at 'Variable Selection X': "PLC_PRG.selX" and at Variable Selection "Y: PLC_PRG.selY". Activate option 'Frame around selected cells'. Press button 'Selection color' and choose color 'yellow'. Close the configuration dialog with OK. The table element now should be displayed as shown in the following:
At the left border the numbers of the array index, at the top the titles of the selected structure components. You can modify the column widths by placing the cursor on the separator between two columns and moving the mouse as soon as the cursor appears as a horizontal double-arrow. .
In online mode the current values of the array elements will be displayed in the table cells. As soon as you select a table cell by a mouse-click, it will get yellow-colored and surrounded by a frame. Example:
The CoDeSys Visualization |
2-29 |