Материал: 69_baudoin2007
1250 |
Biotechnol. Prog., 2007, Vol. 23, No. 5 |
Figure 5. Glucose consumption inside the cellular microchip according to the flow rates and the ammonium chloride loadings.
Figure 6. NH3 production, estimated resulting from the glutamine metabolism, inside the cellular microchip according to the flow rates and the ammonium chloride loadings. Production at 10 mM could not be detected.
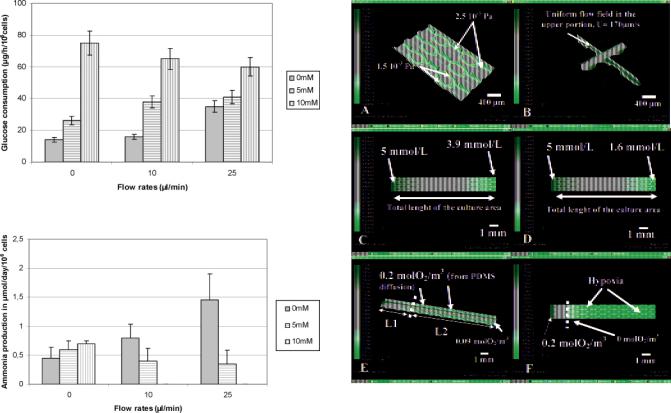
uniform flow at the upper portion of the cell cultures (as shown by the arrow in Figure 7B). In addition, the microstructures behaved as obstacles, improving fluid resistance. This allowed a reduction of the fluid velocity at the bottom surface where the cells were attached.
In terms of nutrient transport, the time of convection, giving the residence time of a molecule driving by the flow inside the microchip, was estimated to be about 60 s and 24 s at 10 and 25 íL/min. Diffusion lengths, LD, of the same molecule during that time, were estimated by relation (4.2). As the maximum interior height of our microchips is 300 ím, this indicates that at a 10 íL/min flow rate, the molecules such as glucose (LD ) 250 ím), ammoniac (LD ) 440 ím), or oxygen LD ) 350 ím) have roughly the time to migrate from the fluid to the cells between the inlet and outlet of the microchip. The situation is less favorable at 25 íL/min (glucose, LD ) 250 ím; ammoniac, LD ) 290 ím; oxygen, LD ) 220 ím).
In Figure 7C, we present the gradient of concentration of glucose along the microchip due to the cell consumption (for 106 cells/microchip at 10 íL/min and using experimental uptake). In those conditions, we found that the cells between the inlet and the outlet of the microchip would consume 20% of the glucose. Those results clearly demonstrate that glucose could be quickly consumed and be in shortage with respect to the total volume of the perfusion. When ammonia was added, we found that 70% of the glucose would disappear between the inlet and the outlet of the microchips (Figure 7D). The oxygen supply originates from the dissolved molecules in the culture medium and the diffusion flux through the PDMS layer. The diffusion calculations show that we do not have hypoxia in our culture conditions if the oxygen diffusion through the PDMS is taken into account (for 106 cells/microchip at 10 íL/
Figure 7. Results of the numerical simulations inside the microchip at 10 íL/min: (A) shear stress contours; (B) velocity profiles; (C) glucose consumption along the microchip based on the data measured and reported in Figure 6; (D) glucose consumption when 10 mM ammonium chloride is added to the culture medium, based on the data measured and reported in Figure 6; (E) oxygen consumption inside the cellular microchip taken into account diffusion through the PDMS;
(F) oxygen consumption inside the cellular microchip without taking into account diffusion through the PDMS.
min). The total length of the cell culture chamber being 1 cm, the dissolved oxygen in the culture medium was consumed in the first 0.25 cm, resulting in a main oxygenation via the PDMS in 75% of the microchip, as shown by Figure 7E.
4.Discussion
4.1.Glucose Metabolism. Glucose is one of the energy sources for the cells, and its consumption was found to increase with increasing flow rate. These results were consistent with the observations of different cell types such as erythrocytes, CHO, when submitted to shear stress (26, 27). In addition, the glucose consumption dramatically increased and the proliferation decreased when we added ammonium chloride in the medium, as reported in the literature (28-30). Metabolism of ammonia transport in the kidney may result mainly from two pathways,
the NH3 passive diffusion through the cell membranes and the active ionic transport of NH4+ through the K+ pathways (such as Na+-K+-ATPase ionic channels, the Na+- H+ exchangers, and the tight junctions (31, 32)). Mechanisms of toxicity of ammonia or ammonium chloride can be linked to the perturbation of intra/extracellular pH and the electrochemical gradients (16). NH3 is a small, uncharged, lipophilic molecule that readily diffuses across cellular membranes. MDCK is reported to have a high NH3 permeability (about 0.7 10-2 cm/s (33)). Therefore, it is reported that the NH3 diffusion will follow the gradient of the chemical potential of NH3 and thus rapidly equilibrate any transmembrane gradient of NH3. As the protonation is extremely fast, the pH will be reconstituted immediately (16). This diffusion will modify the intracellular
Biotechnol. Prog., 2007, Vol. 23, No. 5
cytoplasm pH that will result in an increasing mitochondria pH level (16). As the main reactions of the energy metabolism are located in the mitochondria, the pH modification in the mitochondria may modify the cell behavior. On the other hand NH4+ transport is very slow and is in competition with other ions (K+ for instance, via their ionic pathways). Na+-K+- ATPase pathways have a high-energy demand (16, 34) and competition between K+ and NH4+ is also energy costly (35)
4.2. Glutamine Metabolism. Glutamine is reported to be another energy source. Metabolism of glutamine leads to the production of ammonia by the cells. The ration Ramm/glu (between produced ammonia and available glutamine) in our experiments was found around 0.25 at 10 íL/min and about 0.5 at 25 íL/ min (when there is no ammonium chloride loadings), which appear weaker than the 1.06 data reported for MDCK growth cultures in other type of bioreactors (36). With a concentration of 2 mM of glutamine in our culture medium, we produce about 0.5 to 1 mM of ammonia. Ammonia is reported to be an inhibitory molecule for the cell proliferation. Investigation of the sensibility of MDCK cells have shown that concentrations of ammonium chloride below 4 mM were not effective on the MDCK, whereas values between 7 and 10 mM reduced the growth rate about 50% (30). However, Butler found that a 2 mM accumulation of ammonia stops the MDCK proliferation (37). Schneider reports that the glutamine metabolism and production of ammonia by the cells decrease the pH in the mitochondria. Therefore, glutamine metabolism helps in diffusing NH3 from the mitochondria to the cytoplasm and then to the culture medium. Our measurements have shown that ammonia production values of 0.5 and 1 mM were obtained after 2 days of cultures. However, the culture medium was periodically changed, and this may explain why we did not observe such growth inhibition (in the experiments without ammonium chloride loading). Furthermore, it is also reported that cell growth values have shown a higher tolerance to ammonia under continuous culture conditions, when compared to static batch cultures (29, 38). Perfusion may contribute to dilute and delay the ammonia concentration and therefore enhance the cell proliferation inside the bioreactors (28). However, additional should be taken into account as far as we observed better proliferation at 10 íL/min flow rate when compared to that of the 25 íL/min one.
In addition, when ammonium chloride was loaded, we found as reported in the literature that the glutamine metabolism was reduced. The ration Ramm/glu in our experiments was found around 0.14 ( 0.025 and 0 (0 ) below our detection limit) at 10 íL/min and about 0.11 ( 0.05 to 0 (below our detection limit) at 25 íL/min for 5 mM and 10 mM loadings, respectively. This was attributed by Miller (38) to a reduction of the flux of glutamate to alpha-ketoglutamate via the glutamate dehydrogenase during the deamination and transamination reactions of the glutaminolysis, whereas Schneider reported that this may result from an effect of the perturbation of intra/extracellular pH and electrochemical gradient (16).
4.3. Cell Density and Microchip Design. A close link between the glucose and the glutamine metabolisms has been shown and it appears that they replace each other when there is a shortage of one of those elements (16). Rapid aerobic glycolis and glutaminolysis with subsequent ammonia excretion appear to be a characteristic of fast growing mammalian cells. This appears consistent with our measurements and morphological observations. In addition, as reported in the literature, we developed a microchip with microstructures to promote a high cell density with respect to the surface/volume ratio. The
1251
maximal reached values were 6.6 107 cells/cm3 and corresponding to 1.15 106 cells/cm2. These values were higher than our results in conventional petri cultures (5 105 cells/ cm2 or 3.3 106 cells/cm3). These tendencies were consistent with other data reported for MDCK cultures in perfusion using microcarrier bioreactors in which 107 cells/mL were reached in the bioreactors, whereas 106 cells/mL was obtained in batch cultures (39). However, thanks to the microtopography, we achieved about a 7-fold higher cell density in our microchip. Due to the geometry, the cell grew up over the microstructures creating 3D like tissue structures. The introduction of microstructures created nonuniform flow fields, protecting the cells from the main flow and offering surface. Literature reported the benefit of such microstructures to protect the cells from mainstream flow for various types of cell culture in microchips (14, 15). In addition, the microstructures of the geometry, because they are located at the bottom of the microchip, allowed permanent cell feedings despite overgrowth over the microchannels walls.
4.4.Physiological Flows. Physiological data for the distal renal tubules reported a diameter of 25 ím to 35 ím, allowing a flow rate of about 10 to 30 nL (40). Therefore, in the distal tubule, the average velocity can be estimated at about 200 to 600 ím/s. If the viscosity of the filtrate in the tubule is taken close to the water one (10-3 Pa.s) or close to the blood (3-4 10-3 Pa s), the local shear stress can be estimated between 0.003 and 0.04 Pa. Thanks to the microgeometry, we could approach in vitro flow conditions as shown by numerical simulations in which we achieved shear stress values between 2 and 6 10-3 Pa inside 100 ím square type microchannels. However, in our experiments using 50 íL/min, resulting in a shear stress of 0.01 Pa, we have found a limitation of the cell proliferation and a large number of dead cells. This observation was consistent with literature reports on investigation of MDCK under shear stress of 9 10-3 Pa, demonstrating a large reduction of the viable cells after 12 h of perfusion (41). Because most of the reabsorption in the kidney is achieved in the proximal tubules, the fluid flow (velocity and shear stress) is reduced in the distal tubule (40). Therefore, MDCK, as distal cells, might be unable to adapt in vitro to higher shear stress values, as already reported (41).
4.5.Molecule Transports in the Model. The choice of the governing equations in the model was consistent with other works reported in the literature (10, 42, 43). However, we could find a large panel of parameters. For instance, oxygenation is a critical issue to maintain healthy tissue and culture conditions. Based on a cell oxygen uptake of 2 10-16 mol O2/s/cell used in the literature for MDCK (44) (and also for other mammalian cells (45)), we noticed that oxygenation resulting from the culture medium alone cannot be sufficient to oxygenate about 1 106 cells. PDMS permeability may allow additional oxygen permeation that can provide oxygenation as shown by the Figure 7E,F. In these cases, the Damkohler number, Da, which is the dimensionless molecule flux induced by the cell uptake, was found to be about 0.75. This means that the cells consume roughly the oxygen at the same rate as the diffusion of the molecules to the cells. However, because the cell number was increased up to 2 106 cells, as reached in some experiments, the model shows that we would be in weak hypoxia conditions (data not shown). In this case, Da was found to be about 1.5, which is however still acceptable. To achieve a fully oxygenated culture, we should work in the model with an oxygen uptake of 1 10-16 mol O2/s/cell. This uptake rate was found
1252
experimentally for chondrocyte cultures (43, 46, 47), resulting therefore in Da ) 0.75.
5. Conclusions
The results have demonstrated the MDCK proliferation during dynamic culture inside the PDMS microchip. Reduction of the proliferation by ammonium chloride, as reported in the literature, demonstrated the potential of the microchip for future in vitro drug analysis. Models for toxicology using fewer animals and less expense, avoiding an intensive labor, should be developed. The challenge of the studies carried out is to preserve the cell functions in culture in dynamic conditions over long time periods to build adequate models for drug screening and pharmacological discovery. The microchips offer the advantage of including a whole new set of technologies. Indeed, they offer the possibility of dynamic cultures and of kinetic studies on microstructured tissues simulating the cellular organizations that are met in vivo more closely than conventional petri dishes.
Acknowledgment
This work was granted by ªle fond social EuropeÂenº and ªla reÂgion Picardieº. This project is included in the regional research program ªIBF-Bioº.
References and Notes
(1)Williams, P. D. The application of renal cells culture in studying drug-induced nephrotoxicity. In Vitro Cell DeV. Biol. 1989, 25 (5), 800-805.
(2)Hayes, A. W. Principles and methods of toxicology, 4th edition; Taylor and Francis: Philadelphia, PA, U.S.A., 2001.
(3)Guillouzo, A. Liver cell models in in vitro toxicology. EnViron. Health Perspect. 1998, 106 (2), 511-532.
(4)Koh, H. L.; Yau, W. P.; Ong, P. S.; Hedge A. Current trends in modern pharmaceutical analysis for drug discovery. Drug DiscoVery Today 2003, 8, 19.
(5)Roberts, S. A. Drug metabolism and pharmacokinetics in drug discovery. Curr. Opin. Drug DiscoVery DeV. 2003, 6, 66-80.
(6)Viravaidya, K.; Sin, A.; Shuler, M. L. Development of a Microscale Cell Culture Analog To Probe Naphthalene Toxcity. Biotechnol. Prog. 2004, 20, 316-323.
(7)Griffith, L.; Naughton, G. Tissue enginneringsCurrent challenges and expanding opportunities. Science 2002, 295, 1009-1014.
(8)Falconnet, D.; Csus, G.; Grandin, M.; Textor, M. Surface engineering approaches to micropattern surfaces for cell-based assays. Biomaterials 2006, 27 (16) , 3044-3063.
(9)Bhatia, S. N.; Yarmush, M. L.; Toner, M. Controlling cell interactions by micropatterning in co-cultures: Hepatocytes and 3T3 fibroblasts. J. Biomed. Mater. Res. 1997, 34, 189-199.
(10)Allen, J. W.; Khetani, S. R.; Bhatia, S. N. In vitro zonation and toxicity in a hepatocyte bioreactor. Toxicol. Sci. 2005, 84, 110- 119.
(11)Tilles, A. W.; Baskaran, H.; Roy, P., Yarmush, M. L.; Toner, M. Effect of oxygenation and flow on the viability and function of rat hepatocytes cocultured in a microchannel flat-plate bioreactor.
Biotechnol. Bioeng. 2001, 73 (5), 379-389.
(12)Leclerc, E.; Corlu, A.; Griscom, L.; Baudoin, R.; Legallais, C. Guidance of liver and kidney organotypic cultures inside rectangular silicone microchannels. Biomaterials 2006, 27, 4109-4119.
(13)Baudoin. R.; Duval, J. L.; Griscom, L.; Baudoin, R.; Legallais, C.; Leclerc, E. Selective control of liver and kidney cells migration during organotypic co-cultures inside fibronectin coated rectangular silicone microchannels. Biomaterials 2007, 28, 1820-1829.
(14)14) Borenstein, J. T.; Terai, H.; King, K.; Weinberg, C.; Kaazempur-Mofrad, M.; Vacanti, J. P. Microfabrication technology for vascularized tissue engineering. Biomed. MicrodeVices 2002, 4 (3), 167-175.
(15)Powers, M. J.; Domansky, K.; Udapadhia, A.; Kazempur-Mofrad, M. R.; Kursawky, P.; Janigan, D.; Wack, K. E.; Stolz, D. B.; Kamm, R.; Griffith, L. A microarray perfusion bioreactor for 3D liver culture.
Biotechnol. Bioeng. 2001, 78, 257.
Biotechnol. Prog., 2007, Vol. 23, No. 5
(16)Leclerc, E.; Sakai, Y.; Fujii, T. Perfusion culture of fetal human hepatocytes in microfluidic environments. Biochem. Eng. J. 2004, 20, 143-148.
(17)Schneider, M.; Marison, I. W.; Von Stockar, U. The importance of ammonia in mammalian cell culture. J. Biotechnol. 1996, 46, 161-185.
(18)Xia, Y.; Whitesides, G. M. Extending microcontact printing as a microlithographic technique. Langmuir 1997, 13, 2059-2067.
(19)Anderson, J. R.; Chiu, D. T.; McDonald, J. C.; Jackman, R. J.; Cherniavskaya, O.; Wu, H.; Whitesides, S.; Whitesides, G. M. Fabrication of topologically complex three-dimensional microfluidic systems in PDMS by rapid prototyping. Anal. Chem. 2000, 72, 3158-3164.
(20)Zanzotto, A.; Szita, N.; Boccazzi, P.; Lessard, P.; Sinskey, A.; Jensen, K. Membrane-Aerated Microbioreactor for high throughput bioprocessing. Biotech. Bioeng. 2004, 87 (2), 243-254.
(21)Charati, S. G.; Stern, S. A. Diffusion of gases in silicone polymer: Molecular dynamics simulations. Macromolecules 1998, 31, 5529-5535.
(22)Kanai, N.; Fujita, Y.; Kakuta, T.; Saito, A. The effects of various extracellular matrices on renal cell attachment to polymer surfaces during the development of bioartificial renal tubules. Artif. Organs 1998, 23 (1), 114-118.
(23)Salas, P. J.; Vega-Salas, D. E.; Rodriguez-Boulan, E. Collagen receptors mediate early events in the attachment of epithelial (MDCK) cells. J. Membr. Biol. 1987, 98 (3), 223-236.
(24)Lee, J. H.; Khang, G.; Lee, J. W.; Lee, H. B. Interaction of different types of cells on polymer surfaces with wettability gradient.
J. Colloid Interface Sci. 1998, 205, 323-330.
(25)Chen, H.; Brook, A. M.; Sheardown, H. Silicone elastomers for reduced protein adsorption. Biomaterials 2002, 25 (12), 2273-2282.
(26)Keane, J. T.; Ryan, D.; Gray, P. P. Effect of shear stress on expression of a recombinant protein by Chinese hamster ovary cells.
Biotechnol. Bioeng. 2003, 20 (81), 211-220.
(27)Kodicek, M.; Mircevova, L.; Marik, T. Energy requirements of erythrocytes under mechanical stress. Biomed. Biochim. Acta 1987, 3, 103-107.
(28)Newland, M.; Greenfield, P. F.; Reid, S. Hybridoma growth limitations: The roles of energy metabolism and ammonia production. Cytotechnology 1990, 3, 215-229.
(29)Miller, W. M.; Wilke, C. R.; Blanch, H. W. Transient response of hybridoma cells to lactate and ammonia pulse and step changes in continuous culture. Bioprocess Eng. 1989, 3, 113-122.
(30)Glacken, M. W.; Fleischaker, R. J.; Sinskey, A. J. Reduction of waste product excretion via nutrient control, possible strategies for maximizing product and cell yields on serum in cultures of mammalian cells. Biotechnol. Bioeng. 1986, 26, 1376-1389.
(31)Knepper, M.; Packer, R.; Good, D. Ammonium transport in kidney. Physiol. ReV. 1989, 69 (1), 179-249.
(32)Chang, H.; Fujita T. a numerical model of acid base transport in rat distal tubule. Am. J. Physiol Renal Physiol. 2001, 281, F222-
F243.
(33)Golchini, K.; Kurzt, I. NH3 permeation through apical membrane MDCK cells is via the lipid pathway. Am. J. Physiology 1998, 255 (7), 135-141.
(34)Harris, S. I.; Balban, R. S.; Barett, L.; Mandel, L. J. Mitochondrial respiratory capacity and Na+ and K+ independent adenosine triphosphate mediated ion transport in the intact renal cell. J. Biol. Chem. 1981, 256, 319-328.
(35)Martinelle, K.; Haggstrom, L. Mechanism of ammonia and ammonium ion toxicity in animal cells: Transport across cell membranes. J. Biotechnol. 1993, 30, 339-350.
(36)Genzel, Y.; Behrendt, I.; KoÃnig, S.; Sann, H.; Reichl, U. Metabolism of MDCK cells during cell growth and influenza virus production in large scale micro carrier culture. Vaccine 2004, 22, 2202-2208.
(37)Butler, M.; Imamura, T.; Thomas, J.; Thilly, W. G. High yield from microcarrier cultures by medium perfusion. J. Cell Sci. 1983, 61, 353-363.
(38)Miller, W. M.; Blanch, H. W.; Wilke, C. R. A kinetic analysis of hybridoma growth and metabolism in batch and continuous suspension culture, effect of nutrient concentration, dilution rate and pH.
Biotechnol. Bioeng. 1988, 32, 947-965.
Biotechnol. Prog., 2007, Vol. 23, No. 5
(39)Butler, M.; Thilly, W. G. MDCK microcarrier cultures: Seeding density effects and amino acid utilization. In Vitro 1982, 18, 213- 219.
(40)Brenner, B. Brenner & Rector's the Kidney, 7th edition; W.B. Saunders Company: Philadelphia, PA, 2004.
(41)Bhat, V. D.; Windridge, W.; Cherry, R. S.; Mandel, L. J. Fluctuating shear stress effects on stress fiber architecture and energy metabolism of cultured renal cells. Biotechnol. Prog. 1995, 11, 596- 600.
(42)Sengers, B. G.; von Donkelaar, C. C.; Oomens, W. J.; Baaijens, F. P. T. Computational study of culture conditions and nutrient supply in cartilage tissue engineering. Biotechnol. Prog. 2005, 21, 1252- 1261.
(43)Allen, J. W.; Bhatia, S. N. Formation of steady state oxygen gradients in vitro, application to liver zonation. Biotech. Bioeng. 2003, 82 (3), 253-262.
(44)Bebok, Z.; Tousson, A.; Schwiebert, L.; Venglarik, C. Improved oxygenation promotes CFTR maturation and trafficking in MDCK monolayers. Am J. Physiol. 2001, 280, C135-C145.
1253
(45)Peachman, K. K.; Lyles, D. S.; Bass, D. A. Mitochondria in eosinophils: Functional role in apoptosis but not in respiration. Proc. Natl. Acad. Sci. U.S.A. 2001, 98, 1717-1722.
(46)Torzilli, P.; Askari, E.; Jenkins, J. Water content and solute diffusion properties in articular cartilage. In Biomechanics of Diarthrodial Joints; Mow, V., Ratcliffe, A., Woo, S. Y., Eds.; Springer: New York, 1990; 363-390.
(47)Allhands, R.; Torzilli, P.; Kallfeltz, F. Measurement of diffusion of uncharged molecules in articular cartilage. Cornell Vet. 1983, 74, 111-123.
(48)Foy, B. D.; Rotem, A.; Toner, M.; Tompkins, R. G.; Yarmush, M. L. A device to measure the oxygen uptake rate of attached cellss Importance in bioartificial organ design. Cell Transplant. 1994, 3, 515-527.
(49)Kemper, W. D. Solute diffusivity. In Methods of Soil Analysis, Part 1, 2nd ed.; Klute, A., Ed.; American Society of Agronomy and Soil Science Society of America: Madison, WI, 1986.
Received November 17, 2006. Accepted July 17, 2007.
BP0603513