Материал: 69_baudoin2007
Biotechnol. Prog. 2007, 23, 1245−1253 |
1245 |
Development of a Renal Microchip for In Vitro Distal Tubule Models
ReÂgis Baudoin, Laurent Griscom,² Matthieu Monge,³ CeÂcile Legallais, and Eric Leclerc*
CNRS UMR 6600, Laboratoire de BiomeÂcanique et GeÂnie BiomeÂdical, Universite de Technologie de CompieÁgne, France, CNRS-SATIE/BIOMIS, Ecole Normale SupeÂrieure de Cachan, Campus de Ker Lann, Bruz, France, and Service de neÂphrologie meÂdecine interne, Centre Hospitalier Universitaire d'Amiens, 80054 Amiens, France
Current developments in tissue engineering and microtechnology fields have allowed the proposal of pertinent tools, microchips, to investigate in vitro toxicity. In the framework of the proposed REACH European directive and the 3R recommendations, the purpose of these microtools is to mimic organs in vitro to refine in vitro culture models and to ultimately reduce animal testing. The microchip consists of functional living cell microchambers interconnected by a microfluidic network that allows continuous cell feeding and waste removal controls by fluid microflow. To validate this approach, Madin Darby Canine Kidney (MDCK) cells were cultivated inside a polydimethylsiloxane microchip. To assess the cell proliferation and feeding, the number of inoculated cells varied from 5 to 10 105 cells/microchip (corresponding roughly to 2.5 to 5105 cells/cm2) and from four flow rates 0, 10, 25, and 50 íL/min were tested. Morphological observations have shown successful cell attachment and proliferation inside the microchips. The best flow rate appears to be 10 íL/min with which the cell population was multiplied by about 2.2 ( 0.1 after 4 days of culture, including 3 days of perfusion (in comparison to 1.7 ( 0.2 at 25 íL/min). At 10 íL/min flow rate, maximal cell population reached about 2.1 ( 0.2 106 (corresponding to 7 ( 0.7 107 cells/cm3). The viability, assessed by trypan blue and lactate deshydrogenase measurements, was found to be above 90% in all experiments. At 10 íL/min, glucose monitoring indicated a cell consumption of 16 ( 2 íg/h/106 cells, whereas the glutamine metabolism was demonstrated with the production of NH3 by the cells about 0.8 ( 0.4 ímol/day/106 cells. Augmentation of the flow rate appeared to increase the glucose consumption and the NH3 production by about 1.5- to 2-fold, in agreement with the tendencies reported in the literature. As a basic chronic toxicity assessment in the microchips, 5 mM and 10 mM ammonium chloride loadings, supplemented in the culture media, at 0, 10, and 25 íL/ min flow rates were performed. At 10 íL/min, a reduction of 35% of the growth ratio with 5 mM and of 50% at 10 mM was found, whereas at 25 íL/min, a reduction of 10% with 5 mM and of 30% at 10 mM was obtained. Ammonium chloride contributed to increase the glucose consumption and to reduce the NH3 production. The microchip advantages, high surface/volume ratio, and dynamic loadings, coupled with the concordance between the present and literature results dealing with ammonia/ammonium effects on MDCK illustrate the potential of our microchip for wider in vitro chronic toxicity investigations.
1. Introduction
The discussions on the REACH European directive tend to suggest the transfer of a large amount of toxicological studies to the chemical and pharmaceutical industries to quantify their product safety. In the addition, the 3R recommendations (reduce, refine, replace) propose to limit as much as possible animal testing. One of the challenges of in vitro toxicity studies is to be able to preserve the cell/tissue functions for the longest time possible to construct adequate long-term pharmaceutical screening models. Chronic toxicity of a substance is usually evaluated on a live animal during several months, up to several years, to investigate the effect of daily administrations. In vitro, chronic toxicity is evaluated only over a few days because the primary
* To whom correspondence should be addressed. CNRS UMR 6600, Laboratoire de BiomeÂcanique et GeÂnie BiomeÂdical, Universite de Technologie de CompieÁgne, France. Phone: 33 (0)3 44 23 79 43. E-mail: eric.leclerc@utc.fr.
² CNRS-SATIE/BIOMIS.
³ Centre Hospitalier Universitaire d'Amiens.
cellular models can only preserve their specific and high activity for these short periods (1-3).
The pharmacological industry and laboratories have today the imperative to carry out reliable in vitro tests over longer periods to refine their diagnosis. Thus, to improve the culture conditions, the conventional Petri in vitro models used in flasks or microwell plates need to be re-evaluated and modified (4, 5). Thanks to progress in engineering fields, such as microtechnologies and tissue engineering, new pertinent tools, ªcellular microchipsº, have been proposed for the pharmaceutical and toxicological studies as alternative supports (6, 7). The controls in the microfabrication technologies allow new approaches to investigate cell-to-cell or cell-material interactions in dynamic and 3D microenvironments mimicking in vivo situations (8-13).
In this frame, various types of cellular microchips using silicon or biocompatible polymers to culture mammalian cells have been developed (14-16). The cellular microchips can be understood as a reaction zone for the toxicological analysis in which the reactive fluids will be tested on the cultivated
10.1021/bp0603513 CCC: $37.00 © 2007 American Chemical Society and American Institute of Chemical Engineers Published on Web 08/29/2007
1246
engineered tissue. Advances in the microfluidic field have enabled us to realize microscale liquid conduits suitable for a continuous supply of nutrition, oxygen, toxic loadings, and waste removal through perfused culture medium (10, 11). The microstructures associated with the microfluidic flows have also demonstrated a secondary function as the microstructures located in the microchips have shown to enhance the reorganization of the cells in 3D tissue like structures (15, 16).
In a previous work, we described a cellular microchip made with polydimethylsiloxane (PDMS) loaded with hepatocarcinoma cell lines (16). In the present study, we present a MDCK cell cultures in a similar PDMS based cellular microchips to demonstrate that the same type of microchip can be used for various cell applications. Second, a toxicity study is performed to demonstrate the potential of the microchips for large-scale toxicity studies. For that purpose, we used two ammonium chloride loadings that are reported to reduce mammalian cell proliferation (17). In addition, we modeled flow and mass transfer within the microchip to present some interpretations of the in vitro results.
2.Materials and Methods
2.1.Polymer. To fabricate the microchip, we used the PDMS polymer (Dow Corning, Sylgard 184). This silicone is ideally suited to microfabrication. PDMS has been widely used in emerging biotechnology fields to construct microchannels and microstructures with the submicron features (18, 19). This material is generally considered to be biocompatible and possesses high gas permeability (20, 21), which allows oxygenation of cells in culture. As PDMS is a transparent material, microchips fabricated with PDMS allow optical observation coupled with real time analysis of the morphological views of the cells. However, the silicone is also accepted to be unfavorable to cell growth and migration due to its low surface energy (12, 13). Fibronectin, an extracellular matrix protein, coated on PDMS, was used to solve this problem. Literature reported that MDCK attached more rapidly to collagen type I to IV, but it was also observed that, after 4 h hours of contact, any difference in adhesion of MDCK with collagen, laminin, and fibronectin was detected (22, 23). Therefore, after microfabrication steps, a surface treatment (described below) was performed.
2.2.Microfabrication. The fabrication details, based on replica molding and PDMS plasma bonding, have been reported previously (18, 19). In summary, the construction of the cell microchip includes a first PDMS layer with the microstructures for cell attachment, which contains a series of microchambers (300 300 100 ím) and microchannels (400 150 100 ím) inside a larger cell culture chamber (100 ím deep). The total depth of this layer was 200 ím and is based on a double photolithography process. A second PDMS layer with a fluidic network is used to close the cell culture chamber. This layer includes an inlet microchannel network and a chamber of 100 ím thick to distribute the culture medium homogenously throughout the cell culture chamber. The resulting microchip has a volume roughly estimated at 30 íL, with a maximal height of 300 ím. The total surface available for cell growth is about 2 cm2 (including a bottom surface of 1 cm2 and side walls of the microchannels, but excluding the top surface of the second PDMS layer).
2.3.Cell Cultures and Media. Renal cells (Madin Darby Canine Kidney, MDCK) were provided by the American Type Culture Collection (ATCC, ref number CCL-34) and were originally extracted from canine distal tubules. The medium, as recommended by ATCC, contained Minimum Essential
Biotechnol. Prog., 2007, Vol. 23, No. 5
Medium (MEM, Eagle), 2 mM L-glutamine, 0.1 mM nonessential amino acids, 1.0 mM sodium pyruvate, 10% of fetal bovine serum, and penicillin-streptomicin (100 units/mL). Batch cultures were performed in T75 flasks (Falcon, Merk Eurolab, Strasbourg, France) using 12 mL of medium. This allowed the confluence of the cells with about 5 105 cells/cm2 (equivalent to 3.3 106 cells/cm3).
2.4. Experiments. In the experiments, the cell cultures were perfused inside the microchips using a perfusion loop, including the culture medium tank, the peristaltic pump, and the microchip. The circuit was interconnected by a 1.5 mm interior diameter silicone tubing.
To enhance initial cell adhesion, the inner surface of the microchips was coated with fibronectin by the introduction of a 10 íg/mL fibronectin solution for about 40 min (24, 25). After washing with culture medium, the cells were inoculated inside the microchips and kept at rest overnight in a 5% CO2 incubator at 37 °C. Initial tested cell density was from 5 to 10 105 cells per microchip (corresponding roughly to 2.5 and 5 105 cells/cm2). After 24 h, the nonattached cells were rinsed and removed. Then the perfusion was started and completed inside the CO2 incubator. The culture medium in the medium tank was periodically changed. Flow rates of 10, 25, and 50 íL/min were used. The perfusion was applied for 72 h, leading to a total of 96 h of culture inside the microchips. For comparative purposes, static cell cultures were also done inside the microchips without perfusion of culture media. For culture experiments in these ªstaticº microchips, only 200 íL of new media were injected for a few seconds every 24 h.
In the case of ammonium chloride loading, a stock solution of 100 mM was prepared. Then, dilutions in the culture medium were performed to achieve concentrations of 5 and 10 mM. After cell adhesion inside the microchips (adhesion performed without ammonium chloride in the culture medium), the cells were exposed to the medium containing the ammonium chloride during the 72 h of perfusion.
2.5. Biochemical Assays and Cell Counting. To demonstrate the viability and the potential of the microchips, basic metabolism of the cells were monitored by measuring the glucose cell consumption and the production of ammonia by the cells in the medium via glutamine metabolism. Glucose and ammonia were measured using the Konelab 20 biochemical analyzer (Thermo Electron Corporation).
The ammonia located in the culture media was measured indirectly by a combination with the alpha-ketoglutarate to create L-glutamate in the presence of NADH. The conversion of NADH to NAD during the L-glutamate formation leads to a decrease of the absorbance at 340 nm that is proportional to the ammonia concentration in the samples.
The glucose was quantified using two enzymatic reactions. At first, the glucose is transformed in D-gluconate and in H2O2 by a glucose oxidase (GOD). Then, in the presence of peroxydase, the oxidation of the 4-aminoantipyrine and phenol, by the H2O2 previously produced, is performed. This led to quinoneimine production. Light intensity induced by quinone-imine production was measured at 510 nm.
The viability was monitored by trypan blue coloration and cytotoxocity was assessed by lactate deshydrogenase (LDH) controls. LDH analysis was performed using the CytoTox96, nonradioactive cytotoxicity assay (Promega kit). A total of 50 íL of a solution containing the buffer assay and substrate mixture was dropped in microwell plates. Then, 100 íL of the culture medium was added and incubated in the dark at room temperature for 30 min. The reaction was stopped by adding
Biotechnol. Prog., 2007, Vol. 23, No. 5 |
|
|
|
|
|
|
|
|
|
|
|
|
|
1247 |
||
Table 1. Nomenclature and Parameters Used in the Simulations |
|
|
|
|
|
|
|
|
|
|
|
|
|
|
||
|
|
|
|
|
|
|
|
|
||||||||
symbol |
nomenclature |
|
|
|
|
|
|
used numerical values and unit |
||||||||
|
|
|
|
|
|
|
|
|
|
|
|
|
|
|
|
|
u |
|
fluid velocity |
m/s |
|
|
|
|
|
|
|
|
|
|
|
|
|
P |
|
pressure |
Pa |
|
|
|
|
|
|
|
|
|
|
|
|
|
Fext,k |
flux of the k nutrient through PDMS |
mol/m2/s |
|
|
|
|
|
|
|
|
||||||
Sk |
source term of a ¼k scalar in the fluid |
0 |
|
|
|
|
|
|
|
|
|
|
|
|
|
|
í |
|
fluid viscosity |
10-3 Pa s |
|
|
|
|
|
|
|
|
|||||
F |
|
fluid density |
1000 kg/m3 |
|
|
|
|
|
|
|
||||||
Vmax,k |
maximal molecules consumption/production by the cells |
mol/s/cell |
|
|
|
|
|
|
|
|||||||
Vmax,O2 |
oxygen maximal cell consumption |
2 |
|
10-16 mol O2/s/cell (43, 44, 45) |
||||||||||||
Vmax,glucose |
glucose maximal cell consumption |
extract from Table 2 |
|
|
|
|||||||||||
N |
cell |
cell density |
5 |
|
105 cell/cm2 |
|
|
|
||||||||
h |
maximal total height of the microdevice |
3 |
|
-4 |
|
|
|
|
|
|
|
|
||||
|
|
10-5 m |
2 |
/s (43, 48) |
||||||||||||
D |
oxygen diffusion coefficient in the fluid |
2 |
|
10 |
|
cm |
|
|||||||||
|
k)O2 |
glucose diffusion coefficient in the fluid |
|
|
10 |
-6 |
|
|
2 |
/s (45 |
- |
47) |
||||
D |
9.4 |
|
|
|
cm |
|||||||||||
|
k)glu |
oxygen diffusion coefficient in the PDMS |
|
|
-5 |
|
|
2 |
/s (20) |
|
|
|||||
DO2, PDMS |
4.1 10 |
|
cm |
|
|
|
||||||||||
CinO2 |
diluted oxygen nutrient concentration at the inlet |
2 |
|
10-7 mol O2/cm3 (43, 48) |
||||||||||||
CoutO2 |
diluted oxygen nutrient concentration at the outlet |
0 |
(case of maximal flux) |
|||||||||||||
¢CO2 |
variation of oxygen concentration |
2 |
|
|
-7 |
|
|
|
|
|
3 |
|
||||
10-6 mol O2/cm |
|
3(43) (case of maximal flux) |
||||||||||||||
CinGlu |
diluted glucose nutrient concentration at the inlet |
5 |
|
10-3 |
mol glu/cm |
(from experimental protocol) |
||||||||||
Hext |
wall PDMS thickness of the microchip |
2 |
-210 |
|
m |
|
|
|
|
|
|
|
||||
Lx |
characteristic convection length |
10 |
|
m |
|
|
|
|
|
|
|
|
|
|||
LD |
characteristic diffusion length |
3 |
|
10-4 m ()h) |
|
|
|
|||||||||
ªthe stop solutionº of the kit. The color development was measured by absorbance spectroscopy at 490 nm filter.
To count the cells, they were detached with perfusion of conventional trypsine-EDTA solution in the microchips and then collected. Then they were stained by trypan blue dye and counted under an optical microscope. To be able to check the cell proliferation, we used, for each point, six microchips. Three were stopped after 24 h at rest to quantify the cell number at the beginning of the experiment. The three last ones were stopped at the end of the experiments (after the 72 h of perfusion for instance).
2.6. Fluid Flow and Mass Transfer Modeling. 2.6.1. Grid.
A portion of our microchip geometry was reproduced using Solidworks software. The geometry was meshed using Gambit software 2.2.3 (Fluent Inc., Lebanon, NH). A grid based on tetrahedral 334 000 elements was implemented in the geometry of the microchip. The mesh quality was controlled by EquiAngleSkew (only 0.18% of elements of the mesh had an EquiAngleSkew between 0.7 and 0.8 and 0% above 0.8) and the EquiSizeSkew (only 0.19% of element had values between 0.7 and 0.8, and 0% above 0.8). Edge ratios and aspect ratios were below 3 for all elements.
2.6.2.Model Assumptions and Boundary Conditions. For our models of the microfluidic microchips, it was assumed that the flow was steady, three-dimensional, and laminar all over the geometry. The walls were considered to be solid. Consequently, a no-slip condition was applied at the wall. Due to the geometry, two symmetries were defined by a zero continuous shear stress value on the side external walls. We adjusted the pressure gradient in the simulation to reach the experimental flow rate and to achieve a parabolic flow profile in the geometry.
2.6.3.CFD Package. The Navier-Stokes equations (momentum and mass conservation) governing fluid motion (velocity, pressure) in the aforementioned conditions were solved by a finite volume method implemented in Fluent 6.2.3 software (Fluent Inc., Lebanon, NH). To model the nutrient transport of various species, advection diffusion equations were added for each corresponding concentration treated as a new variable name ªscalarº ¼k in Fluent. A segregated algorithm was applied to solve the equations so as to lower the memory requirements imposed by the complex geometry. Used equations are reported below and nomenclature, parameters, and inputs values are summarized in Table 1.
|
|
|
|
|
|
|
@ui |
) 0, |
mass balance |
(1) |
||||||
|
|
|
|
|
|
|
@xi |
|
||||||||
|
|
|
|
|
|
|
|
|
|
|
|
|
|
|||
|
Fuj |
@u |
i |
) - |
@P |
i |
+ í |
@2u |
i |
|
, momentum balance |
(2) |
||||
|
|
|
|
|
|
|
||||||||||
|
@x |
j |
|
@x |
i |
|
@x |
@x |
|
|||||||
|
|
|
|
|
|
|
i |
|
|
j |
|
|||||
@ |
(Fui k - FDk |
|
@ k |
)) Sk, |
|
|
advection diffusion balance |
|||||||||
@x |
@x |
|
|
|||||||||||||
i |
|
|
|
|
|
i |
|
|
|
|
|
|
(3) |
|||
|
|
|
|
|
|
|
|
|
|
|
|
|
|
|
|
|
The boundary conditions of eq 3 were described by wall flux. The sets of eqs 3.1 to 3.4 were used to describe the metabolic flux. In the case of oxygen transport, a diffusion flux was added to take into account the oxygen diffusion through the PDMS wall of the microchip (Fext). This was done to describe the gas exchange through the materials. Glucose consumption was also modeled using parameters extracted from the experimental results (see Discussion sections).
At the bottom layers of the microchip, describing the cell activity we have
(-FDk |
@ k |
) |
|
) F(NcellVmax,k - Fext,k) |
(3.1) |
||||||||
@x |
|||||||||||||
|
i |
cell,wall |
|
|
|
|
|
|
|
||||
At the top layers of the microchips, we have |
|
||||||||||||
|
(-FDk |
@ k |
) |
|
) FFext,k |
|
|
|
(3.2) |
||||
|
@x |
|
|
|
|
||||||||
|
|
|
|
i top,wall |
|
|
|
|
|
|
|||
Finally, we have the external flux values of |
|
|
|
||||||||||
Fext,k)02 ) D02,PDMS |
C02,out - C02,in |
) |
¢C02 |
(3.3) |
|||||||||
zout |
- zint |
|
Hext |
|
|||||||||
|
|
|
|
|
|
|
|
||||||
|
|
|
Fext,k)glucose ) 0 |
|
|
|
(3.4) |
||||||
In addition, we defined the convection time tC and the
diffusion time tD by |
|
||
tC ) LX/Umax |
(4.1) |
||
and |
|
||
LD ) x |
|
|
(4.2) |
DItD |
|||
1248 |
Biotechnol. Prog., 2007, Vol. 23, No. 5 |
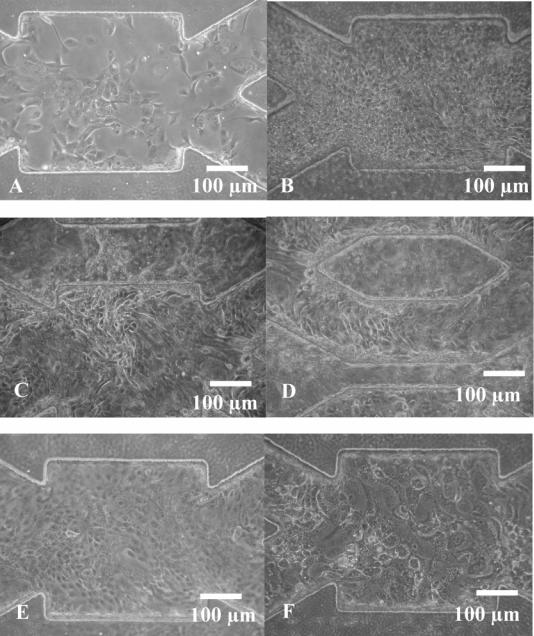
Figure 1. Morphological observations of the MDCK inside the cellular microchip using a 10 íL/min flow rate: (A) after seeding and 12 h at rest, the cells successfully attached to the surface; (B) after 24 h of perfusion, corresponding to 36 h of culture the cell proliferate to create a confluent monolayer; (C,D) after 72 h of perfusion, corresponding to 96 h of culture, the cells grow over the microstructures to create ª3D-like tissueº ; (E) after 72 h of perfusion with 5 mM of ammonium chloride, cells do not spread over the microstructures; (F) after 72 h of perfusion with 10 mM of ammonium chloride, cells appear bigger than in other culture conditions.
The Damkohler number, which is the dimensionless molecule flux, induces by the cell uptake
Da ) |
NcellVmax,Ih |
|
|
(5) |
|
|
||
|
DICin |
|
2.6.4. Post-treatment. At the end of each run, the convergence criteria were checked. They concerned the relative errors in velocity, according to x,y,z coordinates and pressure. An additional validation was made by comparing the inlet and outlet flow rates, which were equal only when the problem was appropriately formulated in Fluent. The software associated after the treatment allowed quantification of the scalars quantities, as well as the wall shear rates along the microchannels, and the velocity profiles in selected cross-sections.
3.Results
3.1.Cell Morphology and Activity. 3.1.1. Perfusions without Ammonium Chloride. Cells attached in all experiments after 24 h at rest, as shown by Figure 1A. Cell proliferation was observed by the optical visualizations, as shown by Figures 1B-D. At first, cells have created a confluent monolayer on the bottom surface. Then, an overgrowth on the microchannel walls was observed. This led to create 3D-like tissue structures and resulted in covering the geometry of the microchannels. Despite the flow rate, any specific cell orientation along the flow in the microchannels was observed when compared with dynamic and static cultures. In all of those experiments, the viability was above 90% except at 50 íL/min (trypan blue results).
Biotechnol. Prog., 2007, Vol. 23, No. 5
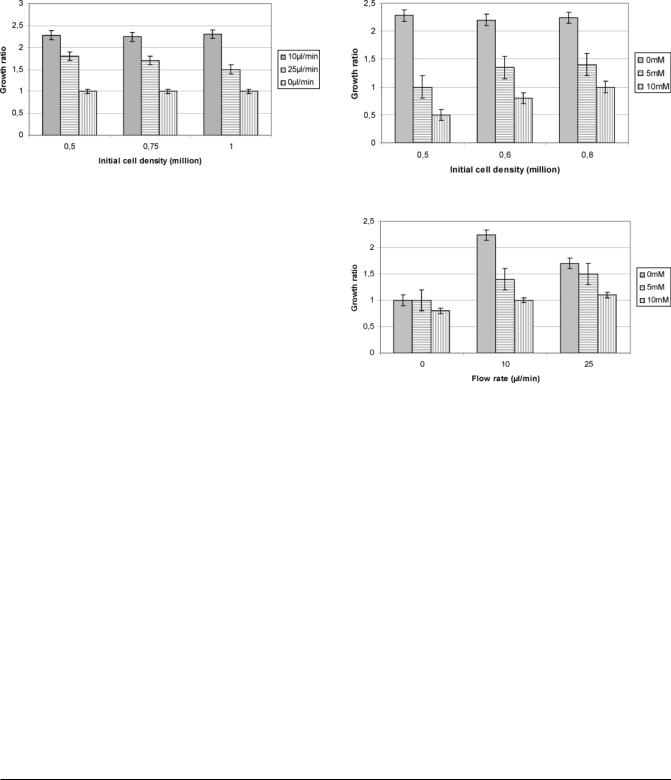
Figure 2. Effect of the flow rates and the initial cell densities on the MDCK proliferation inside the cellular microchip.
The cell proliferation was not affected by the initial cell density for the tested cases (5 to 10 105 cells/microchip), as demonstrated for three cases by Figure 2. In all static cases (inside the microchips flow rate was 0 íL/min), the cell number remained similar between the beginning and the end of the cultures. When there was no applied flow, the cells did not proliferate. On the contrary, for flows of 10 íL/min, initial cell density multiplied roughly by 2.2 ( 0.1, and at 25 íL/min, the population increased by 1.7 ( 0.2, as shown by the Figure 2. The measured glucose consumption, which corresponds to the cell metabolism, was about 16 ( 2 íg/h/106 cells at a flow rate of 10 íL/min and 35 ( 5 íg/h/106 cells at 25 íL/min (Table 2). The maximum cell density achieved in the microchip was 6.6 107 cells/cm3 at 10 íL/min and 4.6 107 cells/cm3 at 25 íL/min (corresponding to 2.3 106 and 1.6 106 cells/ microchip, respectively). LDH levels were very low, demonstrating healthy culture conditions (Table 2). Ammonia production was found higher at 25 íL/min, with a production of 1.4 ( 0.3 ímol/day/106 cells when compared to 0.8 ( 0.4 ímol/ day/106 cells at 10 íL/min (Table 2).
At 50 íL/min, for all inoculated densities, the cells detached after 24 h of perfusion. Viability was found below 10%.
3.1.2. Experiments with Ammonium Chloride. When the ammonium chloride was added to the culture medium, we clearly observed a reduction of the cell proliferation, as shown by Figure 1E,F. Morphological observations have shown that the cell shape and size were bigger when the ammonium chloride was loaded, especially at 10 mM, as shown by Figure 1E,F. We estimated roughly that the cells were 1.4- and 5.9- fold bigger with the ammonium chloride loading (at 5 mM and 10 mM, respectively) when compared to none loaded experiments. The 5 mM concentration contributed to the reduction of the growth ratio to about 1.5- to 2-fold, whereas 10 mM concentrations reduced the cell growth ratio to about 2- to 4-fold at 10 íL/min, as shown by Figure 3. In addition, the reduction of the cell proliferation was found relatively more important when the initial cell density was lower, as shown by Figure 3.
1249
Figure 3. Effects of the ammonium chloride loading on the cell proliferation at 10 íL/min.
Figure 4. Effects of the ammonium chloride loading and the flow rates on the cell proliferation with an inoculated cell density of 0.75 106 cells/microchip.
At 5 mM and 10 mM, 5 105 cells multiplied respectively by 1 and 0.5, whereas 8 105 cells multiplied respectively by 1 and 1.4. However, in terms of proliferation, Figure 4 shows that the ammonium chloride effect was more important at 10 íL/min than at 25 íL/min.
Metabolism analyses clearly show that the ammonium chloride increases the glucose consumption of the cells and reduces the ammonia production in perfusion, as shown by Figures 5 and 6. Despite the ammonium chloride loading, the viability of the collected cells was above 90% and LDH levels remained low.
3.2. Model Outputs. The inlet flow rate of 10 and 25 íL/ min used experimentally created shear stress values of 2-3 10-3 and 5-6 10-3 Pa, respectively. The averaged velocity was calculated to 100 and 220 ím/s (with a maximal value in the Poiseuille velocity profile of 170 ím/s and 400 ím/s, respectively), as shown by Figure 7A,B (10 íL/min case). Because the microstructures of the geometry are located at the bottom of the microchip, the design of the microchip allowed
Table 2. MDCK Metabolism with 0, 5, and 10 mM Ammonium Chloride at 0, 10, and 25 íL/mina
|
flow rates (íL/min) |
|
|
0 |
|
|
|
10 |
|
|
|
25 |
|
|
|
NH4Cl concn (mM) |
0 |
5 |
10 |
0 |
5 |
10 |
0 |
5 |
10 |
|
|||
|
|
|
|
|
|
|
|
|
|
|
||||
glucose consumption |
14 ( 2 |
26 ( 3 |
75 ( 1 |
16 ( 3 |
38 ( 5 |
65 ( 1 |
35 ( 5 |
41 ( 1 |
60 ( 1 |
|
||||
(íg/h/106 cells) |
0.6 ( 0.25 |
0.6 ( 0.2 |
0.7 ( 0.2 |
0.8 ( 0.4 |
0.4 ( 0.2 |
|
1.4 ( 0.3 |
0.35 ( 0.13 |
|
|
||||
NH3 production |
0** |
0** |
|
|||||||||||
(ímol/h/106 cells) |
<1% |
<1% |
<1% |
<1% |
<1% |
<1% |
<1% |
<1% |
<1% |
|
||||
LDH |
|
|||||||||||||
(% dead/living cells) |
1 ( 0.2 |
1 ( 0.2 |
0.8 ( 0.1 |
2.2 ( 0.2 |
1.7 ( 0.2 |
0.8. ( 0.2 |
1.7 ( 0.1 |
1.5 ( 0.1 |
1 ( 0.2 |
|
||||
growth ratio |
|
|||||||||||||
(initial cell multiplied by) |
|
|
|
|
|
|
|
|
|
|
|
|
|
|
a The data was extracted after 96 h of culture, including 72 h of perfusion. The initial cell density was (0.7 ( 0.1) 106 cells. Data was represented by mean ( SD (n g 3), **denotes data below the detection limit.