Материал: General propedeutics of internal diseases_Nemtsov-LM_2016
in persons with thin abdominal wall, the urinary bladder can be palpated over the pubic bone as an elastic fluctuating formation. If the bladder is markedly distended, its superior border reaches the umbilicus. In the long-term ischuria the urinary bladder is determined at a palpation as a rounded elastic body in suprapubic range of abdomen.
Palpation of ureteric points
Tenderness at palpation along the course of ureter and sensitive loin (sensitive to pressure exerted in the angle between the 12-th rib and the longissimus thoracic muscles) is of certain diagnostic importance. Palpation of the anterior surface of abdomen and lumbar range in some cases enables to determine presence of the pain points connected to an affection of kidneys and urinary tract.
Three pairs of anterior ureteric points: (1) subcostal point - at the anterior end of 10-th rib; it corresponds to renal pelvis; (2) superior ureteric point - at the edge of the rectus abdominis muscle at the level of the umbilicus; it corresponds to superior third of ureter; (3) medium ureteric point - at the intersection of the biiliac line and the vertical line passing the pubic tubercle; it corresponds to medium third of ureter.
Two pairs of posterior ureteric points: (1) costovertebral point - in the angle formed with the inferior edge of 12-th rib and a columna vertebralis;
(2) costolumbar point – at the intersection of lumbar muscle and 12-th rib. Pressure in these points in norm routinely painless becomes sharply
responsive at a pyelonephritis, a paranephritis, a nephrolithiasis, a tumor and tuberculosis of kidneys.
Auscultation of renal arterias
Auscultation in diagnostics of kidneys disease is used for recognition of pathology of renal arterias. Systolic murmurs of renal artery stenosis can be auscultated in lumbar range in a costovertebral angle and on anterior abdominal wall in points placed 5 sm above umbilicus and near 4-5 sm aside.
160
LITERATURE
1.Bates B., Bickley L. S., Hoekelman R.A. Physical Examination and History Taking, 6-th Edition. –J.B. Lippincott Company, Philadelphia, 1995. - 711 pp.
2.Harrison's Principles of Internal Medicine, 15-th Edition/ Editors: Braunwald E., Fauci A.C., Kasper D.S. et al. - McGraw-Hill Companies, Inc., New York, 2001. – 2118 pp.
3.Internal Diseases: an Introductory Course / Под ред. В.Х.
Василенко, А.Л. Гребенева. – М.: Мир, 1990. – 648 с (на англ. яз.).
4.The Merck Manual of diagnostics and therapy, 17-th. Edition / Editors: Beers M.H. and Berkow R. – Merck Research Laboratories, Portland, 1999. – 2883 pp.
5.Милькаманович В.К. Методическое обследование, симптомы и симптомокомплексы в клинике внутренних болезней: Руководство для студентов и врачей. - Минск, 1994. – 672 с.
6.Практические навыки по пропедевтике внутренних болезней: Под ред. Н.Е. Федорова. – Витебск, ВГМУ, 2003. – 264 с.
7.Практические навыки терапевта: Справочное издание. Под ред. Г.П. Матвейкова. - Минск: “Вышейшая школа”, 1993. – 656 с.
8.Пропедевтика внутренних болезней: Учебник для студентов
медицинских ВУЗов / Под ред. акад. РАМН В.Т. Ивашкина и проф. А.А. Щептулина. – М.: МЕДпресс-информ, 2003. – 544 с.
9.Довгялло О.Г., Сипарова Л.С., Федоренко Н.М. и др. Руководство к практическим занятиям по пропедевтике внутренних болезней: Для мед. ин-тов. - Минск: “Вышейшая школа”, 1986. – 190 с.
10.Федоров Н.Е. Пропедевтика внутренних болезней (Основы диагностики и частной патологии внутренних органов): Лекционный курс.- ВГМУ, 2001.- 489 c.
11.Шишкин А.Н. Внутренние болезни. Распознавание, семиотика, диагностика. СПб.: Изд-во “Лань”, 2000. – 384 с.
161
Supplement
Electrocardiography examination
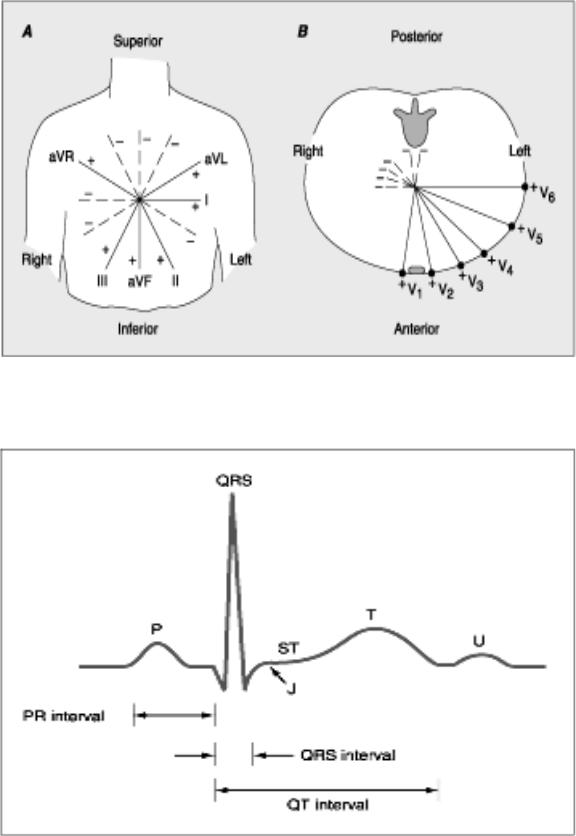
Fig. Suppl. 1.The six frontal plane and six horizontal plane leads provide a threedimensional representation of cardiac electrical activity. The frontal plane leads – standard (I, II, III) and augmented leads (aVR, aVF, aVL). The horizontal plane leads – chest leads (V1-6).
Fig. Suppl. 2. Basic waves and intervals of normal ECG.
162
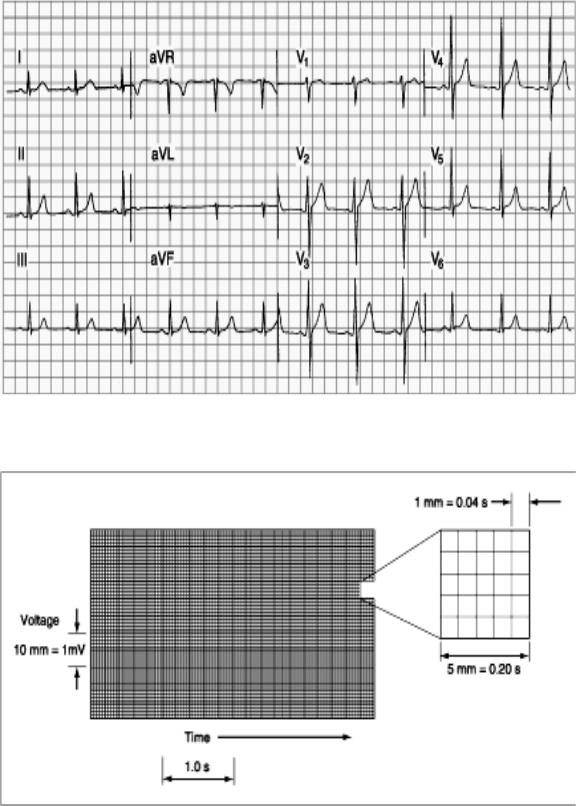
Fig. Suppl. 3. Normal ECG of the healthy subject. Sinus rhythm is present with a heart rate of 75 per minute. PR interval is 0.16 s; QRS interval (duration) is 0.08 s; QT interval is 0.36 s; the mean QRS axis is about +70°, transition zone V3.
Fig. Suppl. 4. The ECG graph paper records the time (interval) between cardiac electrical events along the horizontal axis and their amplitude (voltage) along the vertical axis.
163
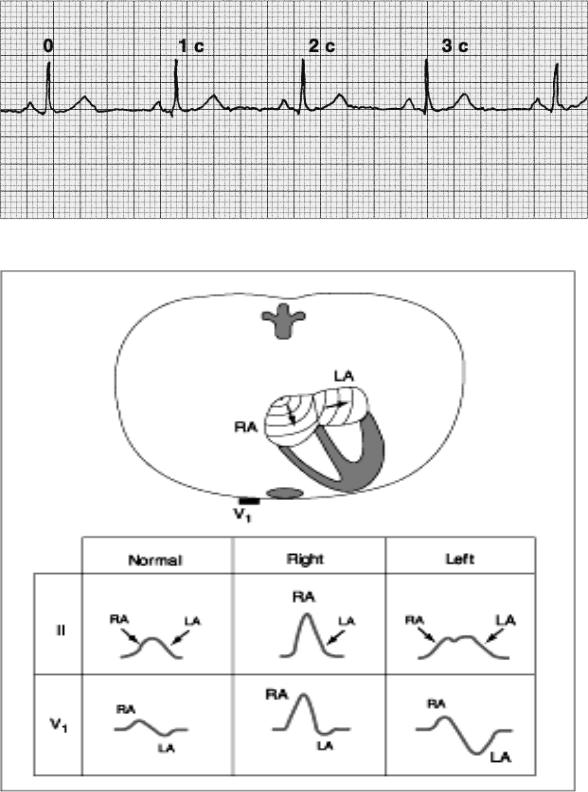
Fig. Suppl. 5. HR determination - multiply in 20 times (×20) the number of R-R intervals during 3 seconds.
Fig. Suppl. 6. ECG in hypertrophy of atriums.
Right atrium hypertrophy is detected by “P pulmonale”: high (>2.5 mm) acute Р in II, III, AVF and right chest leads (V1-2).
Left atrium hypertrophy is detected by “P mitrale”: wide (>0.1 s), splitted Р-wave in I, II, AVL, V5-6; flat or negative Р in III, biphasic or negative Р (>1 mm) V1.
164