Материал: m933302e
2 - The Visualization Editor in CoDeSys
pressed (or using the arrow keys). Alternatively you can select and move the corner indicating little square outside of the element. In order to move the element to another position, click inside the element to get the cursor beeing displayed as vertically crossed arrows and then move the cursor.
'Insert' 'Bitmap'
Symbol: 
With the command you can insert a bitmap as an element in your present visualization. (Use, see Visualization Elements, Insert).
While pressing the left mouse button, bring up an area in the desired size. The dialog box is opened for opening a file. Once you have selected the desired bitmap, it will be inserted into the area brought up. You can define in the bitmap configuration dialog, whether a just link to the bitmap file should be stored or the bitmap should be inserted as an element.
'Insert' 'Visualization'
Symbol: 
With the command you can insert an existing visualization as an element in your present visualization. (Use, see Visualization Elements, Insert).
While pressing the left mouse button, bring up an area in the desired size. A selection list of existing visualizations opens. After you have selected the desired visualization, it will be inserted in the defined area.
An inserted visualization will also be named as an instance.
'Insert' 'Button'
Symbol: 
This command is used to insert a button into your current visualization. (Use, see Visualization Elements, Insert).
Drag the element to the desired size with the left mouse button held down.
If a toggle variable is configured for the button it displays the state of this variable by visually displaying whether it is pressed or not pressed. Conversely, the variable is toggled by „pressing" the button.
'Insert' 'WMF file'
Symbol: 
This command is used to insert a Windows Metafile. The standard dialog for opening a file will appear, where you can select a file (extension *.wmf). After having closed the dialog with OK the file will be inserted as an element in the visualization. Please regard, that no link to a file will be saved, like it is done when you insert a bitmap, but the elements of the metafile will be inserted as a group.
'Insert' 'Table'
Symbol: 
Use this command to insert a Table element as an element into your current visualization. It is used to display the current values of the elements of an array.
While pressing the left mouse button, bring up an area in the desired size. Before the element gets displayed the configuration dialog 'Configure table'' will be opened. Here you will find additionally to the standard categories Tooltip and Security the categories 'Table', 'Columns', 'Rows' and 'Selection' where you can define contents and appearance of the table.
The CoDeSys Visualization |
2-5 |
2 - The Visualization Editor in CoDeSys
'Insert' 'Meter'
Symbol: 
Use this command to insert a Meter as an element into your current visualization. It provides a scale which is defined as a sector of a circular arc, and a pointer element.
While pressing the left mouse button, bring up an area in the desired size. Before the element gets displayed the configuration dialog Configure Meter will be opened. Here you can define various parameters concerning the display of the element and a preview is available to check the configuration before really inserting the element by confirming the dialog.
'Insert' 'Bar Display'
Symbol: 
Use this command to insert a Bar Display element into your current visualization. It is used to visualize the value of the assigned variable by a bar indicating the value by its lenght along a horizontal scale.
While pressing the left mouse button, bring up an area in the desired size. Before the element gets displayed the configuration dialog 'Configure bar display' will be opened. Here you can define various parameters concerning the display of the element and a preview is available to check the configuration before really inserting the element by confirming the dialog.
'Insert' 'Histogram'
Symbol: 
Use this command to insert a Histogram element into your current visualization. It is used to visualize the elements of an array by bars which are placed side by side each indicating the value of the element by its length.
While pressing the left mouse button, bring up an area in the desired size. Before the element gets displayed the configuration dialog 'Configure Histogram' will be opened. Here you can define various parameters concerning the display of the element and a preview is available to check the configuration before really inserting the element by confirming the dialog.
'Insert' 'Alarm table'
Symbol: 
Use this command to insert an alarm table into your current visualization object.
While pressing the left mouse button, bring up an area in the desired size. Before the element gets displayed the configuration dialog 'Configure Alarm table' will open. Here you will find additionally to the standard categories Tooltip and Security the categories 'Alarmtable', 'Settings for sorting', 'Columns' and Settings for alarmtable' where you can define contents and appearance of the table.
An alarm table can be used to visualize the alarms, which have been defined in the Alarm configuration of the project.
'Insert' 'Trend'
Symbol:
Use this command to insert a trend element into your current visualization object.. While pressing the left mouse button, bring up an area in the desired size. The configuration (axes, variables, history) is done in the configuration dialog 'Trend'.
The trend element, also named oszilloscope element, is used to display variable values within a certain time period. It stores the data in a file on the client and displays them as a graph. As soon as a value changes, a new entry will be made in the file, showing date/time and the new value.
The trend element is drawn transparently. So you can assign any desired background (bitmap, color).
2-6 |
The CoDeSys Visualization |

2 - The Visualization Editor in CoDeSys
2.3Positioning of Visualization Elements...
Selecting Visualization Elements
The selection mode is activated by default. In order to select an element, click with the mouse on the element. You can also select the first element of the elements list by pressing the <Tab> key and jump to the next by each further keystroke. If you press the <Tab> key while pressing the <Shift> key, you jump backwards in the order of the elements list.
In order to select elements, which are placed one upon the other, first select the top level element by a mouse-click. Then do further mouse-clicks while the <Ctrl> button is pressed, to reach the elements in the underlying levels .
In order to mark multiple elements, press and hold the <Shift> key and click the corresponding elements, one after another; or, while holding down the left mouse button, pull a window over the elements to be selected.
In order to select all the elements, use the 'Extras' 'Select All' command.
If you are in the element list (called by 'Extras' 'Element list'), you can select the concerned element in the visualization by selecting a line.
Changing the Selection and Insert Mode
After the insertion of a visualization element, there is an automatic change back into the selection mode. If you want to insert an additional element the same way, you can once again select the
corresponding command in the menu or the symbol  in the tool bar.
You can also quickly change between the selection mode and the insert mode by pressing the <Ctrl>- key and the right mouse button simultaneously.
In the insert mode, the corresponding symbol will also appear at the mouse pointer, and the name will also be indicated in black in the status bar.
'Extras' 'Select'
This command is used to switch the selection mode on or off. This can also be achieved using the symbol  or by pressing the right mouse-key while holding down the key at the same time.
'Extras' 'Select All'
This command allows you to select all visualization elements within the current visualization object.
Copying Visual Elements
One or more selected elements can be inserted with the 'Edit' 'Copy' command, the <Ctrl>+<C> key combination, or the corresponding copy symbol, and with 'Edit' 'Paste'.
A further possibility is to select the elements and to again click in one of these elements with the <Ctrl> key held down. If you now hold the left mouse button down, you can separate the elements thus copied from the original.
Modifying Visualization Elements
You can select an element which has already been inserted by a mouse click on the element or by pressing the <tab> key. A small black square will appear at each corner of each of the elements, (with ellipses at the corners of the surrounding rectangle). Except in the case of polygons, lines or curves further squares appear in the middle of the element edges between the corner points.
The CoDeSys Visualization |
2-7 |
2 - The Visualization Editor in CoDeSys
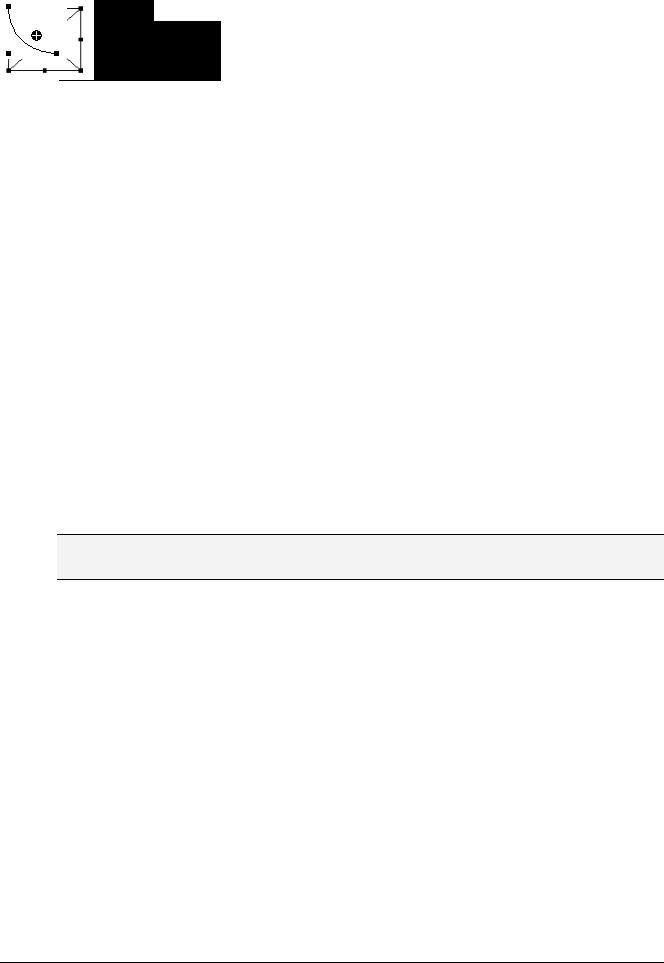
With a selected element, the turning point (balance point) is also displayed at the same time. You can then rotate the element around this point with a set motion/angle. The turning point is displayed as a
small black circle with a white cross ( ). You can drag the turning point with a pressed left mouse button.
You can change the size of the element by clicking on one of the black squares and, while keeping the left mouse button pressed, controlling the new outline.
With the selection of a polygon, you can drag each individual corner using the same technique. While doing this, if you press the <Ctrl>-key then an additional corner point will be inserted at the corner point, an additional corner point will be inserted, which can be dragged by moving the mouse. By pressing the <Shift>+<Ctrl>-key, you can remove a corner point.
Dragging Visualization Elements
One or more selected elements can be dragged by pressing the left mouse button or the arrow key.
Grouping Elements
Elements can be grouped by selecting all desired elements and performing the command 'Extras' 'Group'. The group will behave like a single element:
•the grouped elements get a collective frame; when dragging the frame all elements will be stretched or compressed; only the group can be moved to another position.
•the grouped elements get collective properties: inputs only can effect the group and not a single element. Thus the elements also get one collective configuration dialog (category 'group'). The property 'Change color' can not be configured for a group !
To redefine a single element of a group, the grouping must be redone by the command 'Extras' 'Break up group'. The configuration of the group will be lost in this case.
Note: As soon as you save the project as CoDeSys Version 2.1 or lower, a group of visualization elements will be resolved automatically; that means that the elements of the group will be shown as single elements in the visualization.
'Extras' 'Send to Front'
Use this command to bring selected visualization elements to the front.
'Extras' 'Send to Back'
Use this command to send selected visualization elements to the back.
'Extras' 'Align'
Use this command to align selected visualization elements. The following alignment options are available:
•Left: the left edge of each of the elements will be aligned to the element that is furthest to the left
•the same is true for Right / Top / Bottom
•Horizontal Center: each of the elements will be aligned to the average horizontal center of all elements
•Vertical Center: each of the elements will be aligned to the average vertical center of all elements
2-8 |
The CoDeSys Visualization |
2 - The Visualization Editor in CoDeSys
'Extras' 'Elementlist'
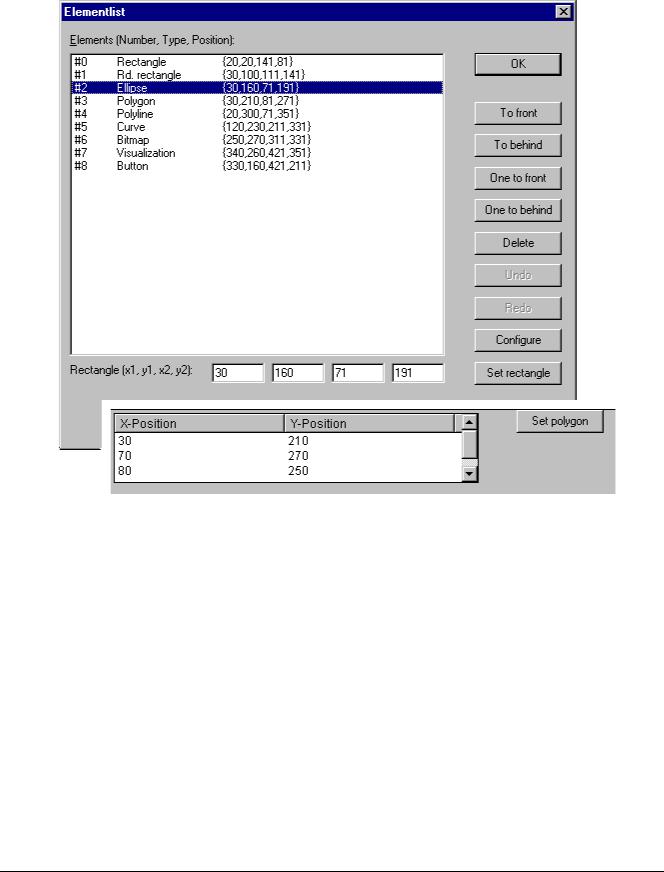
This command opens a dialog box containing a list of all visualization elements including their number, type and position. The position is given according to the x and y position of the upper left (x1, y1) and the lower right (x2, y2) corner of the element.
Element list dialog box
When one or more items have been selected, the corresponding elements in the visualization are marked for visual control and if necessary the display will scroll to that section of the visualization that contains the elements.
Use the To front button to bring selected visualization elements to the front. Use the To behind button to move them to the back.
Below the elements list there you find – depending on which element is currently selected - one of the following combinations of edit fields where you can modify size and position of the element:
•If a rectangle, rounded rectangle, ellipse, bitmap, visualization, button or a meta file is currently selected, then next to the text "Rectangle (x1, y1, x2, y2)" there are four edit fields, where the actual x/y positions are shown and can be modified.
•If a line, polygon or a curve is currently selected, a table will be available showing the actual X- Position and Y-Position of each of the black squares which mark the shape of the element, as soon as it is selected. These values can be edited here.
To set the modified position values in the elements list and in the visualization, press button Set rectangle (in case 1.) resp. Set polygon (in case 2.).
Use the Delete button to remove selected visualization elements.
The CoDeSys Visualization |
2-9 |